Why is the Market so Good?
The market is messy, biased, and annoyingly hard to beat

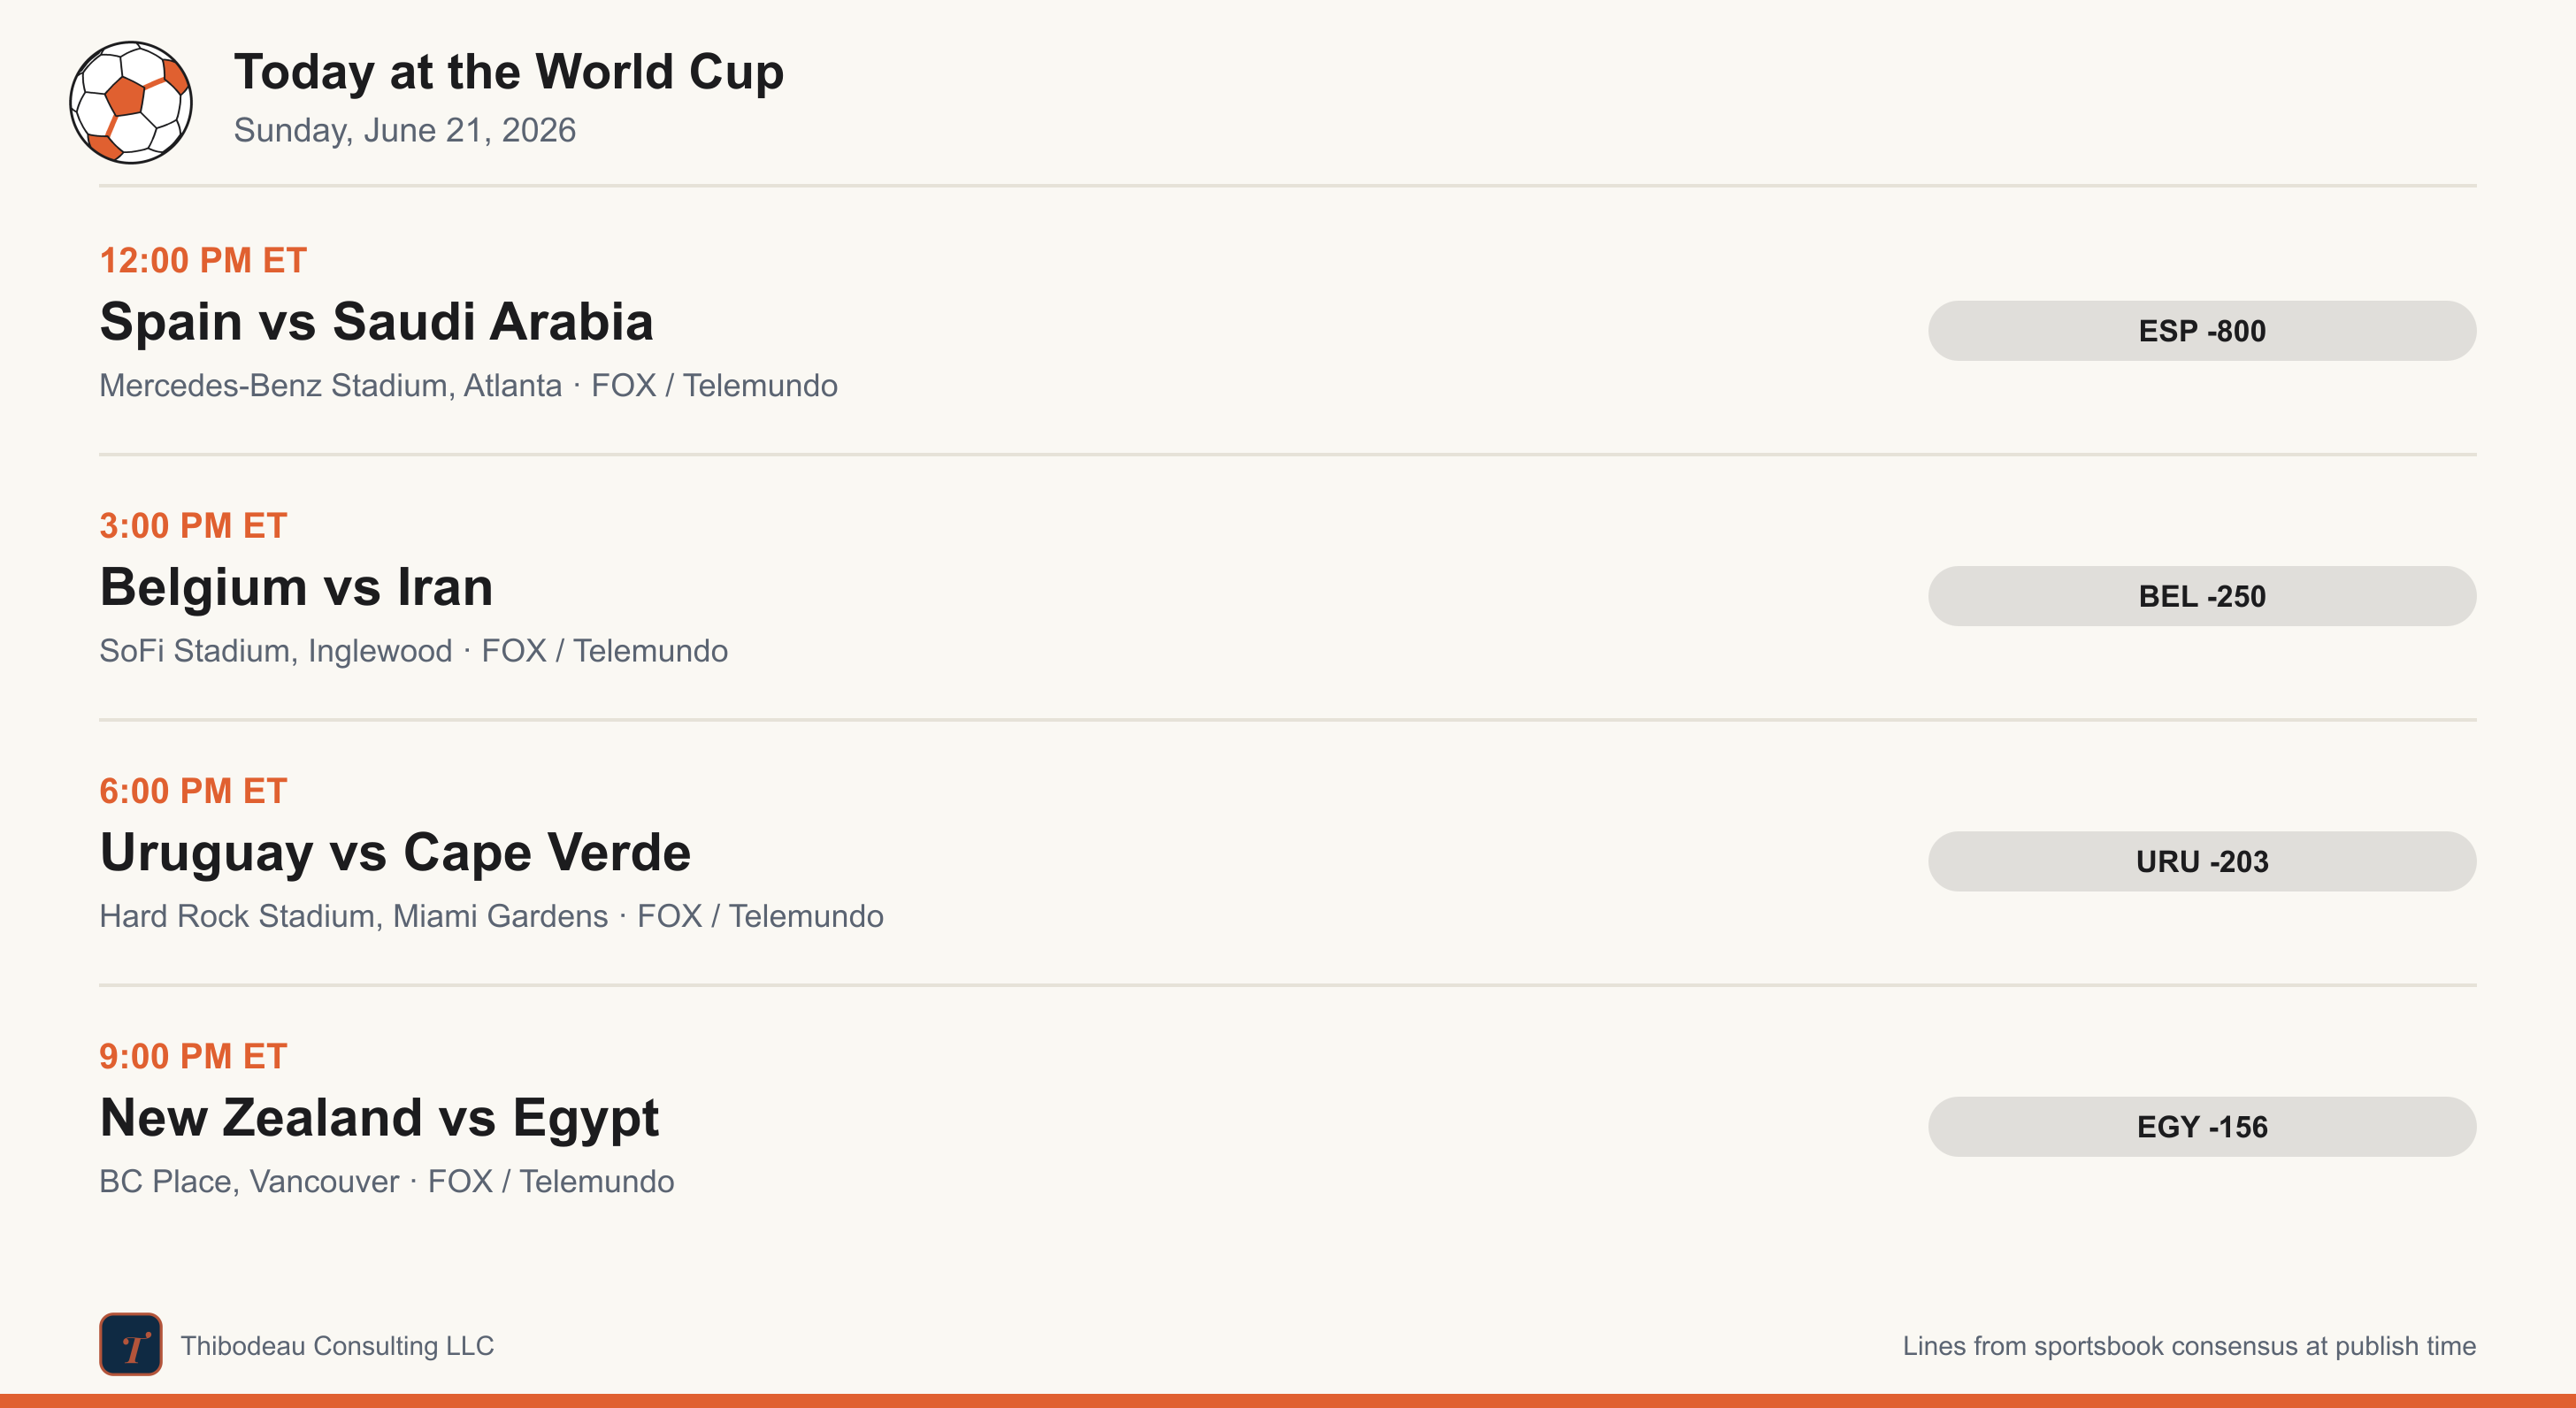
Day eleven, and Spain gets another try. The pre-tournament favorite returns after opening with the draw that made every forecast look a little too certain. Cape Verde returns too, no longer just a charming debutant but a team the market has already had to reprice. Add Belgium-Iran, Uruguay-Cape Verde, and New Zealand-Egypt, and today is a good day to ask what the betting market knows that our models do not. But first, a quick recap.
Previously, at the World Cup
Day ten mostly belonged to the favorites. The Netherlands brushed aside Sweden 5-1, Germany edged Ivory Coast 2-1 on a stoppage-time winner, and Japan routed Tunisia 4-0 to send them home. Then Ecuador broke the pattern. An 86 percent favorite on nearly every board, Ecuador was held scoreless by Curaçao, whose keeper Eloy Room gave the tiny island its first ever World Cup point.
The Ecuador draw echoed the Spain-Cape Verde lesson from earlier in the tournament: a near-unanimous favorite, a scoreless draw, and a reminder that even a forecast in the mid-80s leaves room for soccer to misbehave. PELE had the best day, with our DSWC Classic just behind; the Ecuador result stung the whole board.
Question 11: Is the market wisdom or pressure?
So far, we have built models from visible ingredients: team quality, recent form, tournament experience, confederation, hosting. Each one is something we can name and measure. That is the appeal. We can point at a number and say what it means.
The betting market is different. It is not one feature. It is a price that bundles almost everything: public models, private models, injuries, lineups, travel, reputation, money flow, bookmaker risk, and whatever sharp bettors know before the rest of us. Convert the odds to probabilities and you are not getting one opinion. You are getting a compressed summary of many opinions, filtered through money.
That makes the market annoying for a data project. It is hard to explain, hard to decompose, and hard to beat. It is also too useful to ignore.
The Market as a Thermometer
The cleanest way to think about the market is as a thermometer for expectation. Spain is not simply “favored.” Spain is favored by a specific amount. Cape Verde is not simply “an underdog.” Cape Verde is an underdog with a specific price. The market turns vague expectation into numbers.
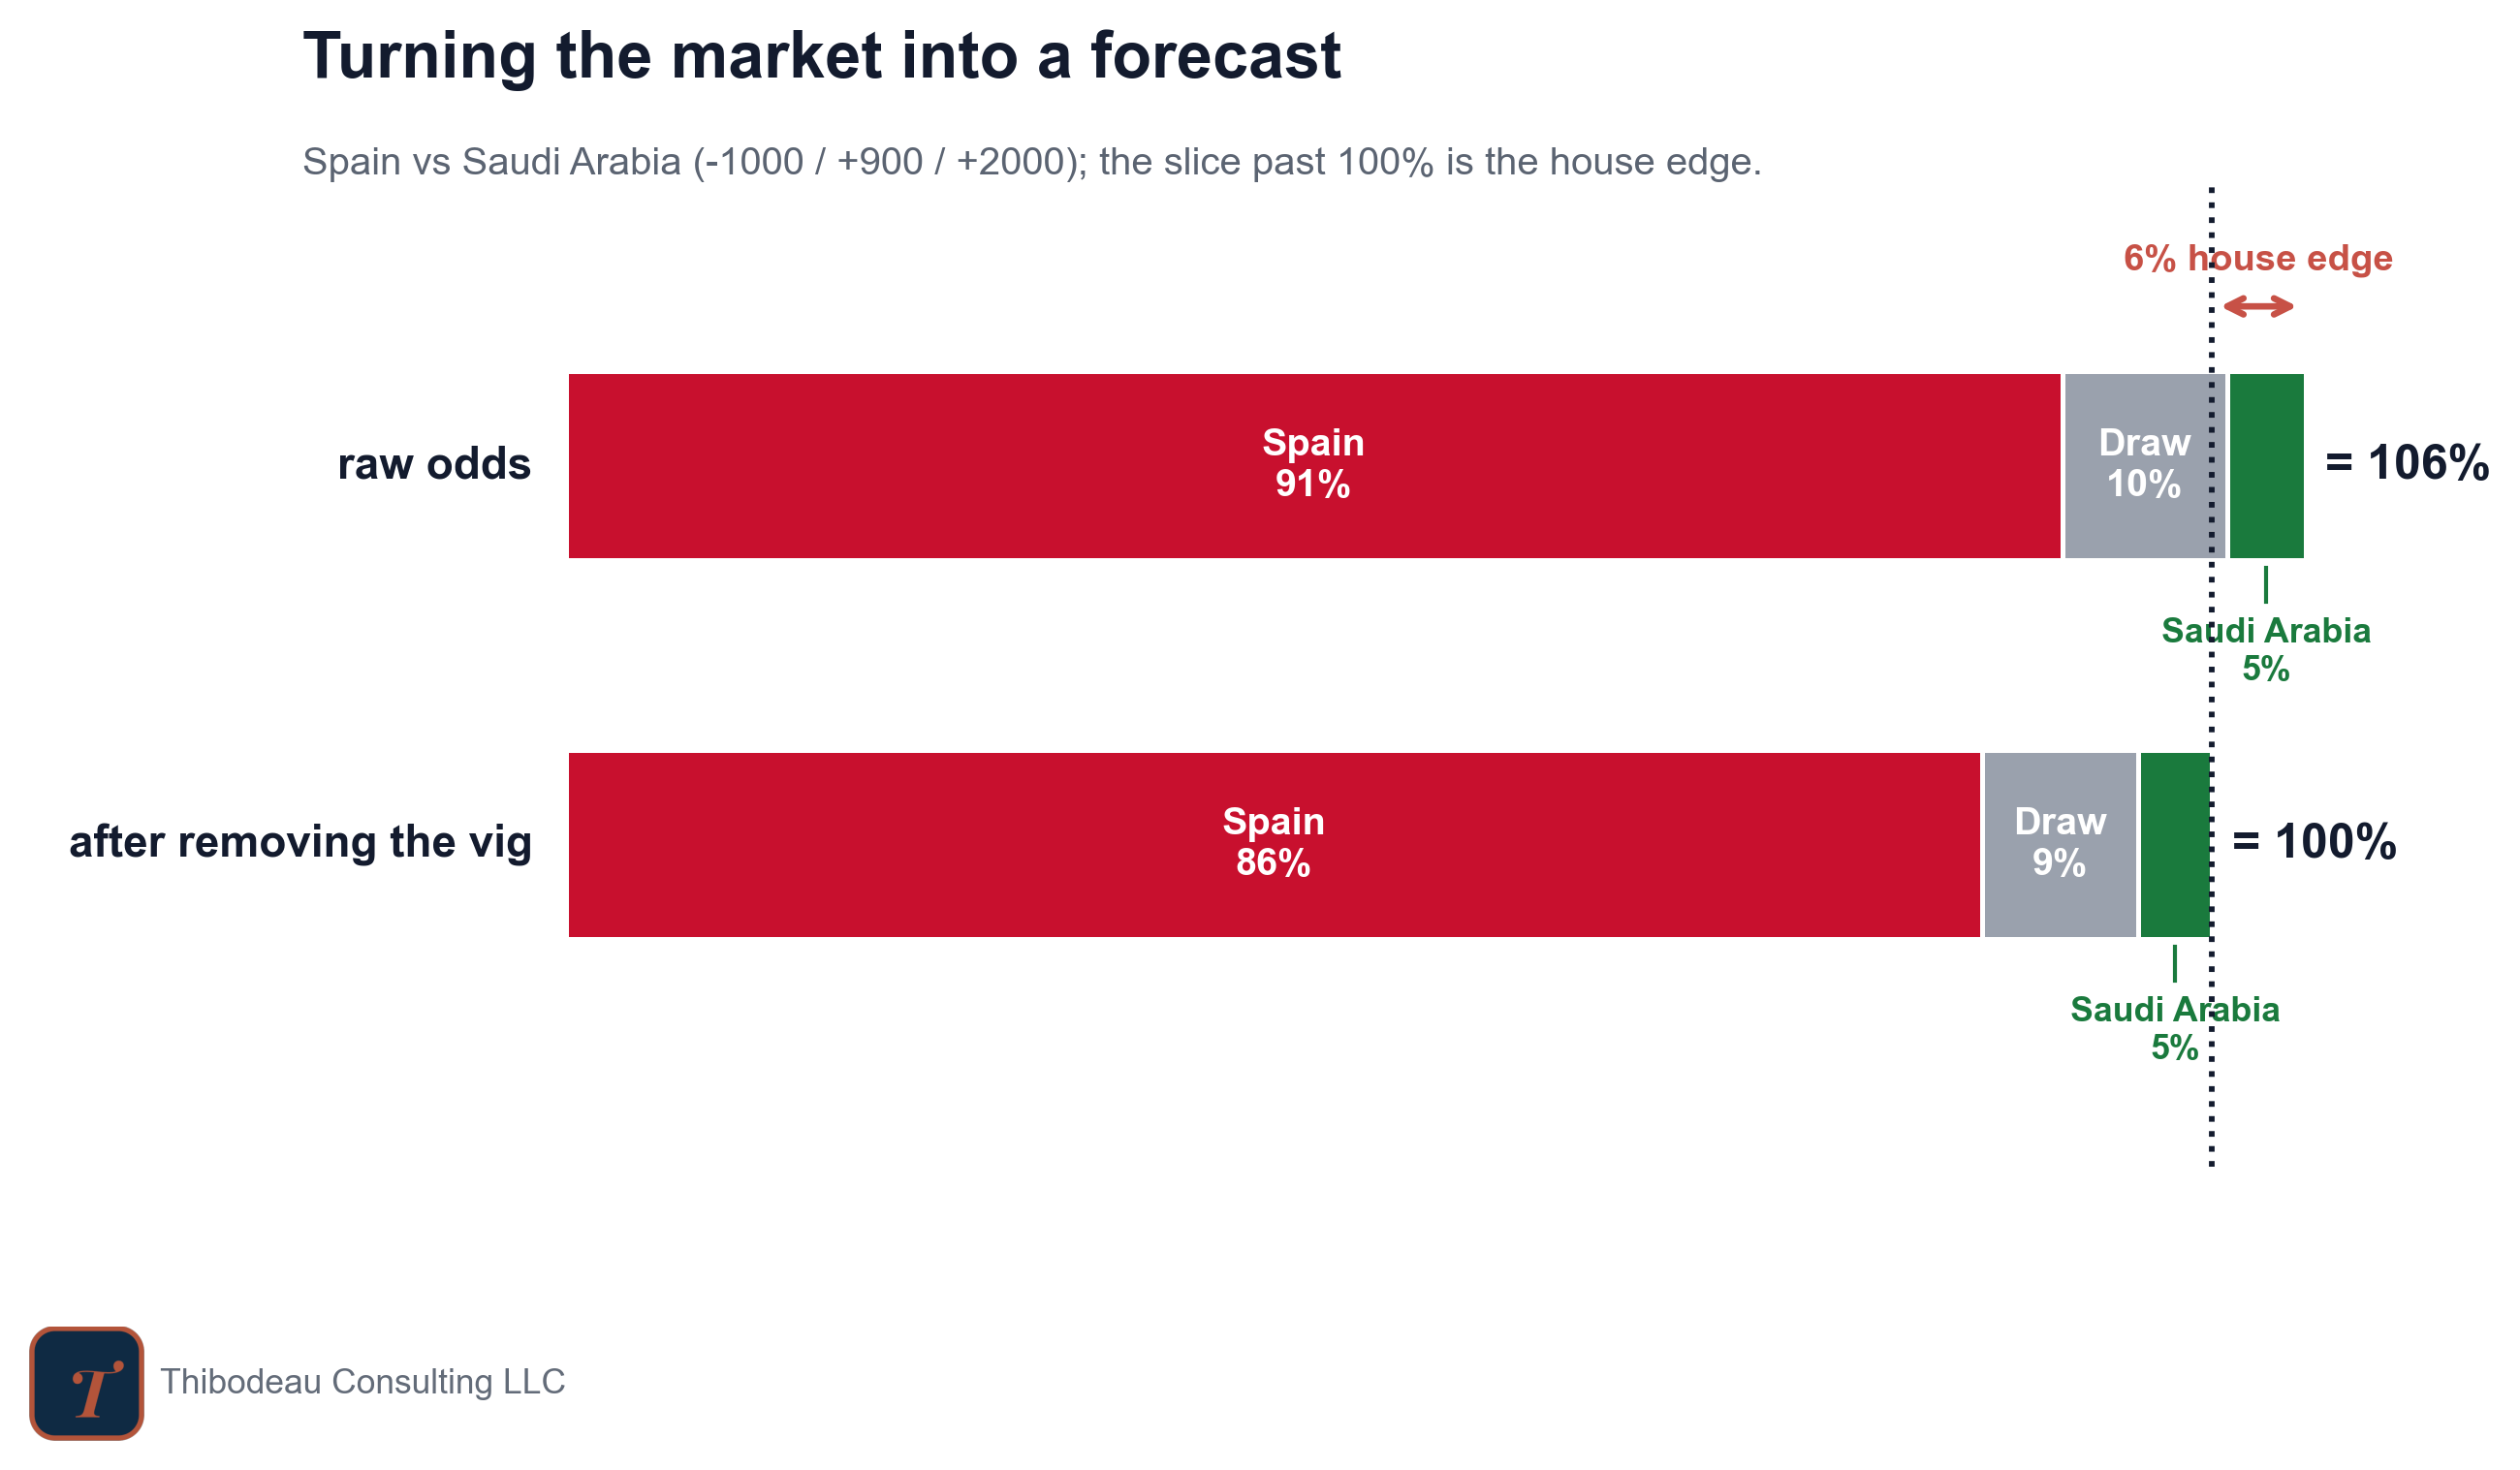
But raw odds are not probabilities yet. Sportsbooks build in a margin, called the vig. Add up the implied chances for win, draw, and loss, and they usually sum to more than 100 percent. The extra is the house edge. Strip it out, renormalize to 100, and the market becomes just another forecast.
Here’s what that looks like for today’s game between Spain and Saudi Arabia.
Pressure, Not Pure Wisdom
Betting markets are often described as the wisdom of crowds, and there is something right about that. A lot of people, carrying different information and incentives, push the price toward what they think is true.
But it is not the clean textbook version. That version works best when people make independent judgments: everyone guesses privately, the errors point in different directions, and the average cancels out a lot of noise. Betting markets are not like that. Bettors see the current price. They react to the same news. They watch the same injuries, rumors, pundits, and sharp moves. The price itself becomes information. The crowd is watching the crowd.
So the better framing is pressure, not pure wisdom. The market does not need the crowd to be independent to work. It runs on incentive.
Being right pays, so anyone who knows something has a reason to bet on it, and their money pulls the price toward what they know. A striker is quietly hurt, a lineup leaks, a center back is suspended, rain is in the forecast: each fact can get dragged into the price by someone trying to profit from it. The crowd does not have to be perfectly wise. It only has to contain enough people who are right about different things, with money on the line.
That same engine is why our model struggles to add anything. Most of what we measure is already in the price. The market knows Spain is good, Uruguay is strong, Cape Verde is new, Belgium’s squad is expensive. So when our model says team quality predicts results, that is rarely an edge. Usually, we have just rediscovered something the price absorbed long ago.
The real test is not whether a feature predicts the result. It is whether it predicts the result after the line already reflects what the crowd knows. That is the bar the market sets, and it is a high one.
The Market Has Biases Too
Markets are not pure truth machines. The same pressure that makes them powerful can also push them around, and the calibration idea from yesterday gives us the right way to think about those cracks. A bias, in the end, is just a calibration error whose direction you can predict.
Through the first 35 games of this tournament, we cannot say much with confidence, but we can describe the pattern so far. The figure below bins every market call into probability buckets. The x-axis is what the market implied; the y-axis is how often those outcomes actually happened. The dashed line is perfect calibration. On the line means the market’s labels are telling the truth.
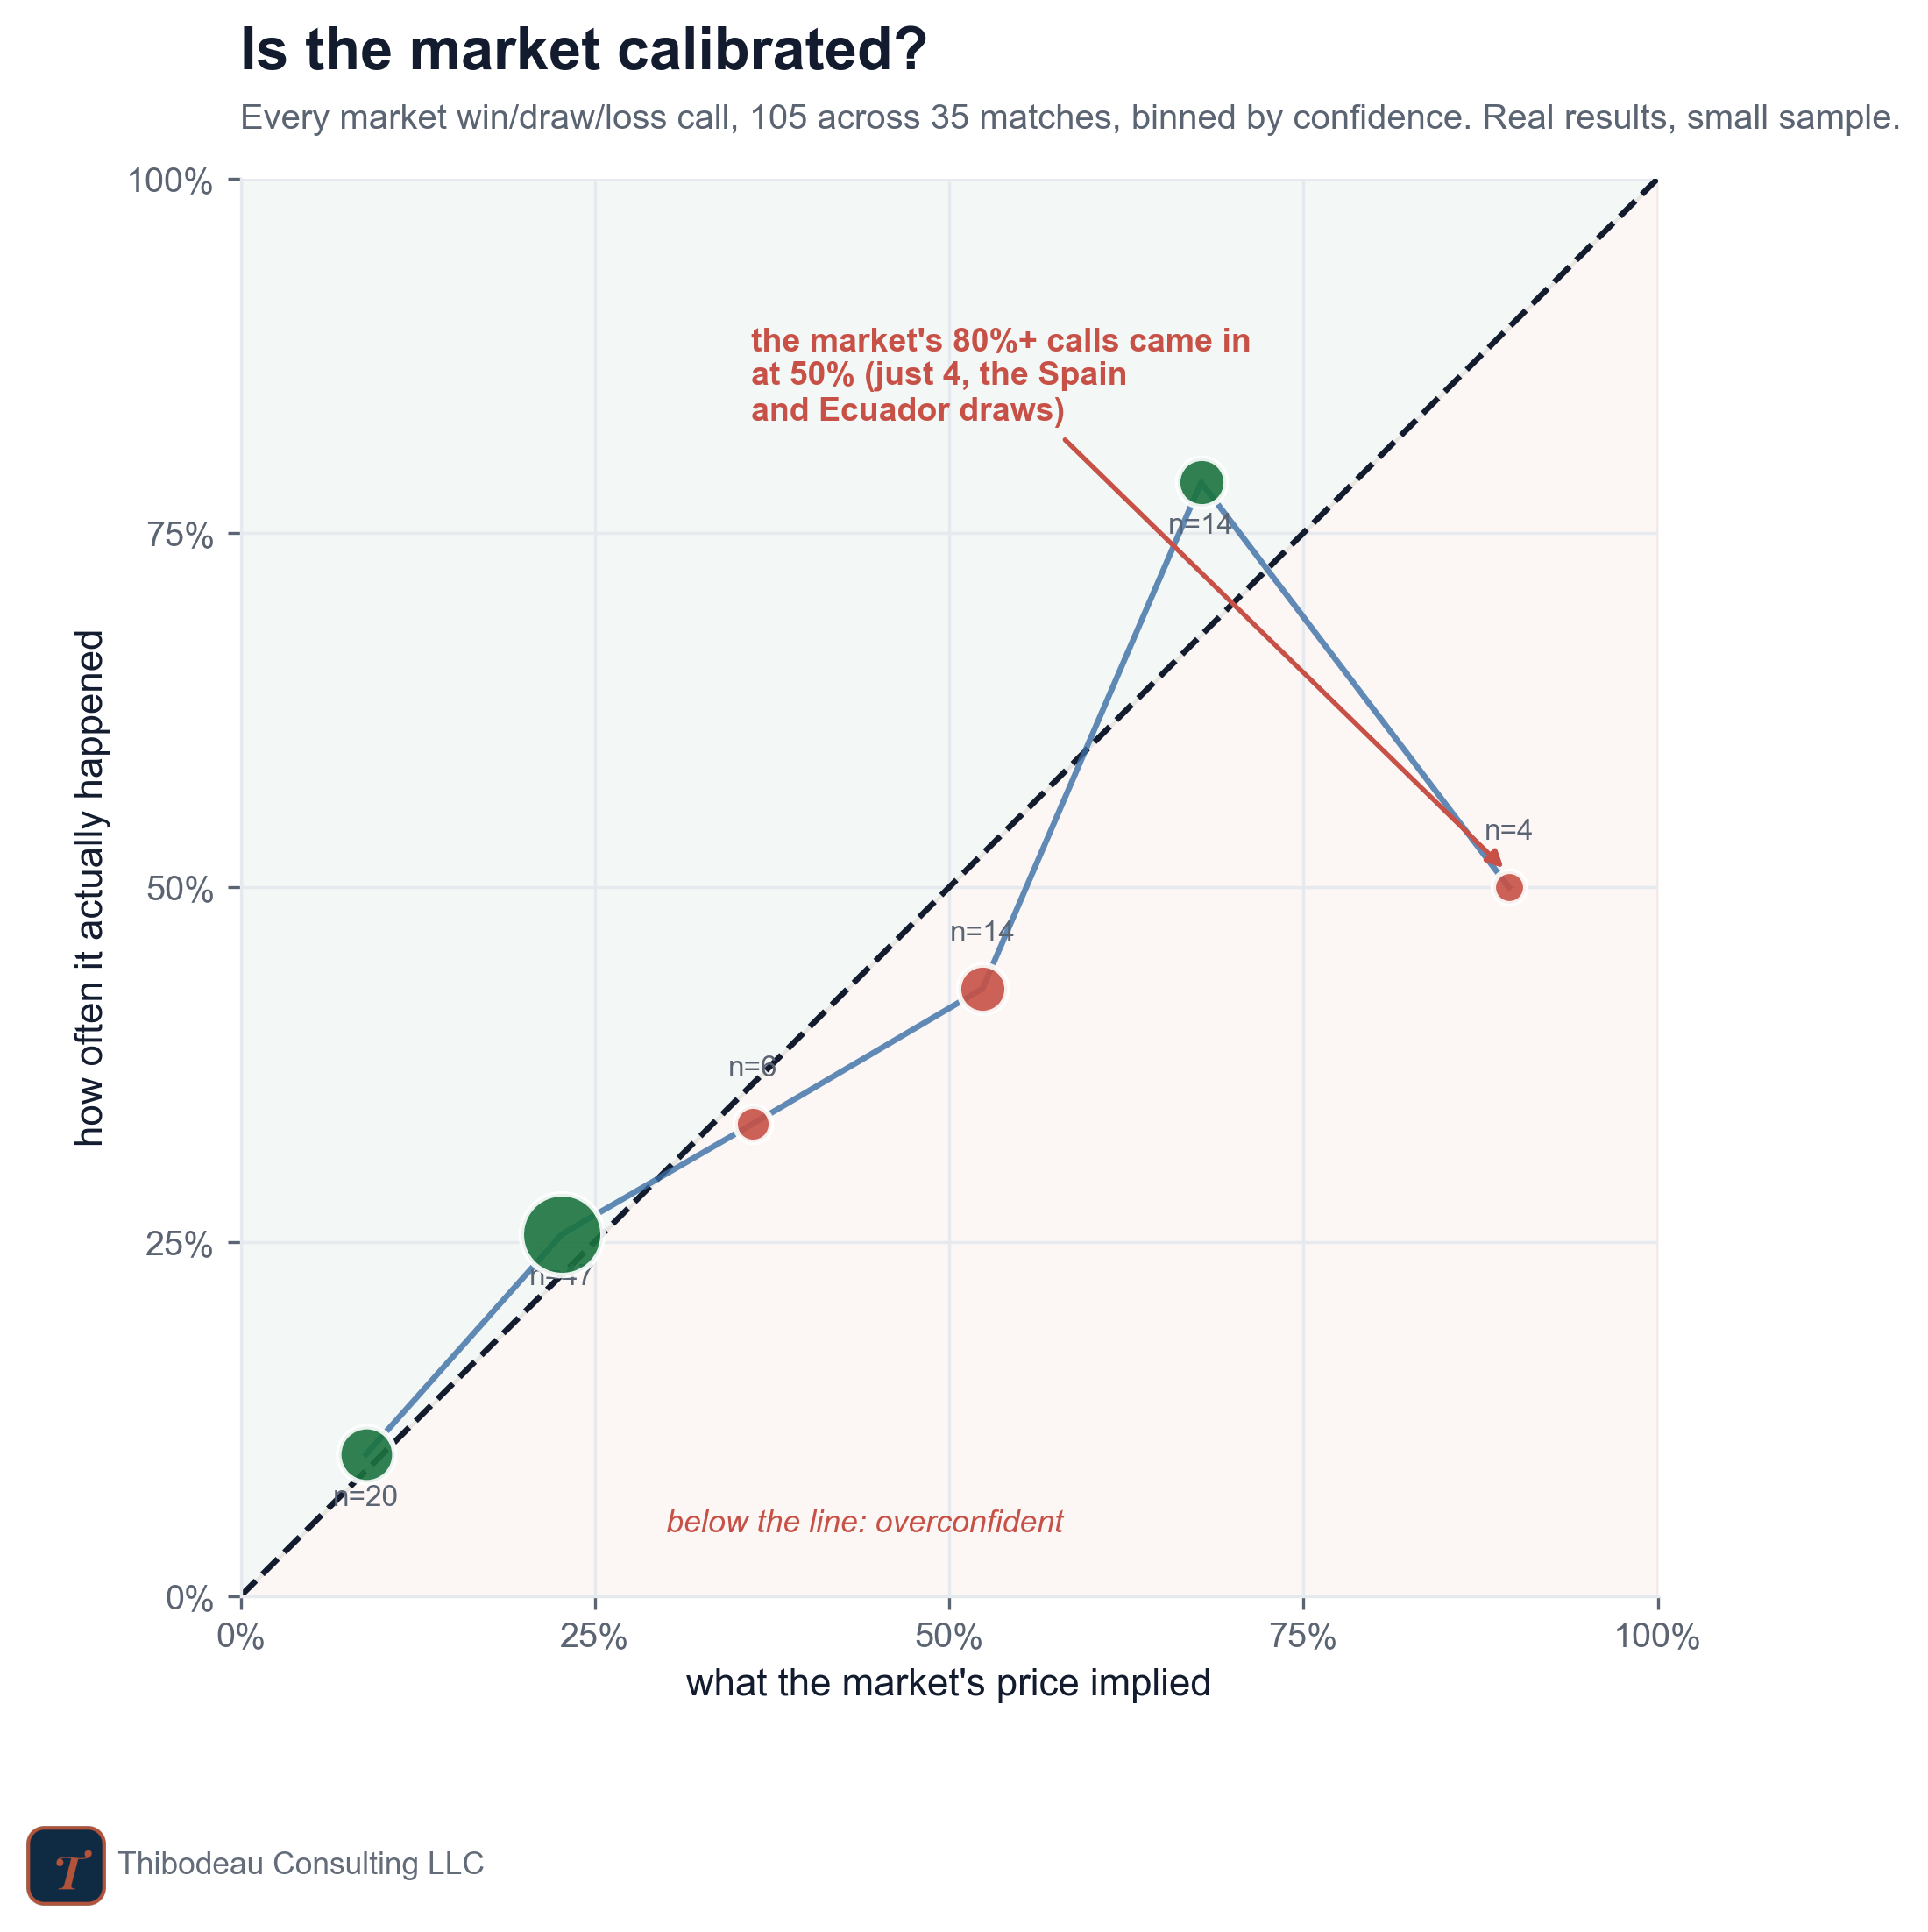
Most of the dots sit close enough to the dashed line that I would not make a big speech about them. The one dramatic-looking spot is the far right: outcomes the market priced above 80 percent have come in only half the time. In plain English, the biggest favorites have underperformed their prices so far.
But that bucket has just four cases, and two of them are the scoreless draws by Spain and Ecuador. That is the problem with reading bias from one tournament in real time. A couple of weird afternoons can make a pattern look much bigger than it is. So the cautious read is this: the market has looked a little overconfident on the heaviest favorites so far, but we do not have nearly enough evidence to call that a real flaw. What we do have is a useful reminder that even an 85 percent favorite still fails about one time in seven.
So the lesson is not “trust the market.” It is “make the market show you what your model is missing.” The market compresses scattered beliefs into a single price, and that price usually holds more information than any one clean model. But it is still a measurement: biased in places, noisy in places, pushed around by incentives, and sometimes wrong.
Up Next
Tomorrow we continue moving from pre-tournament information to in-tournament information. The first week gave every team one or two new data points: goals, draws, bad misses, weird scorelines, injuries, and pressure moments. The question now is how much of that should matter. A model that ignores the tournament is stubborn; a model that overreacts to every result is just chasing noise. So we’ll start looking at the features and quirks that only appear once the games begin.
Today’s Scorecard and Forecasts
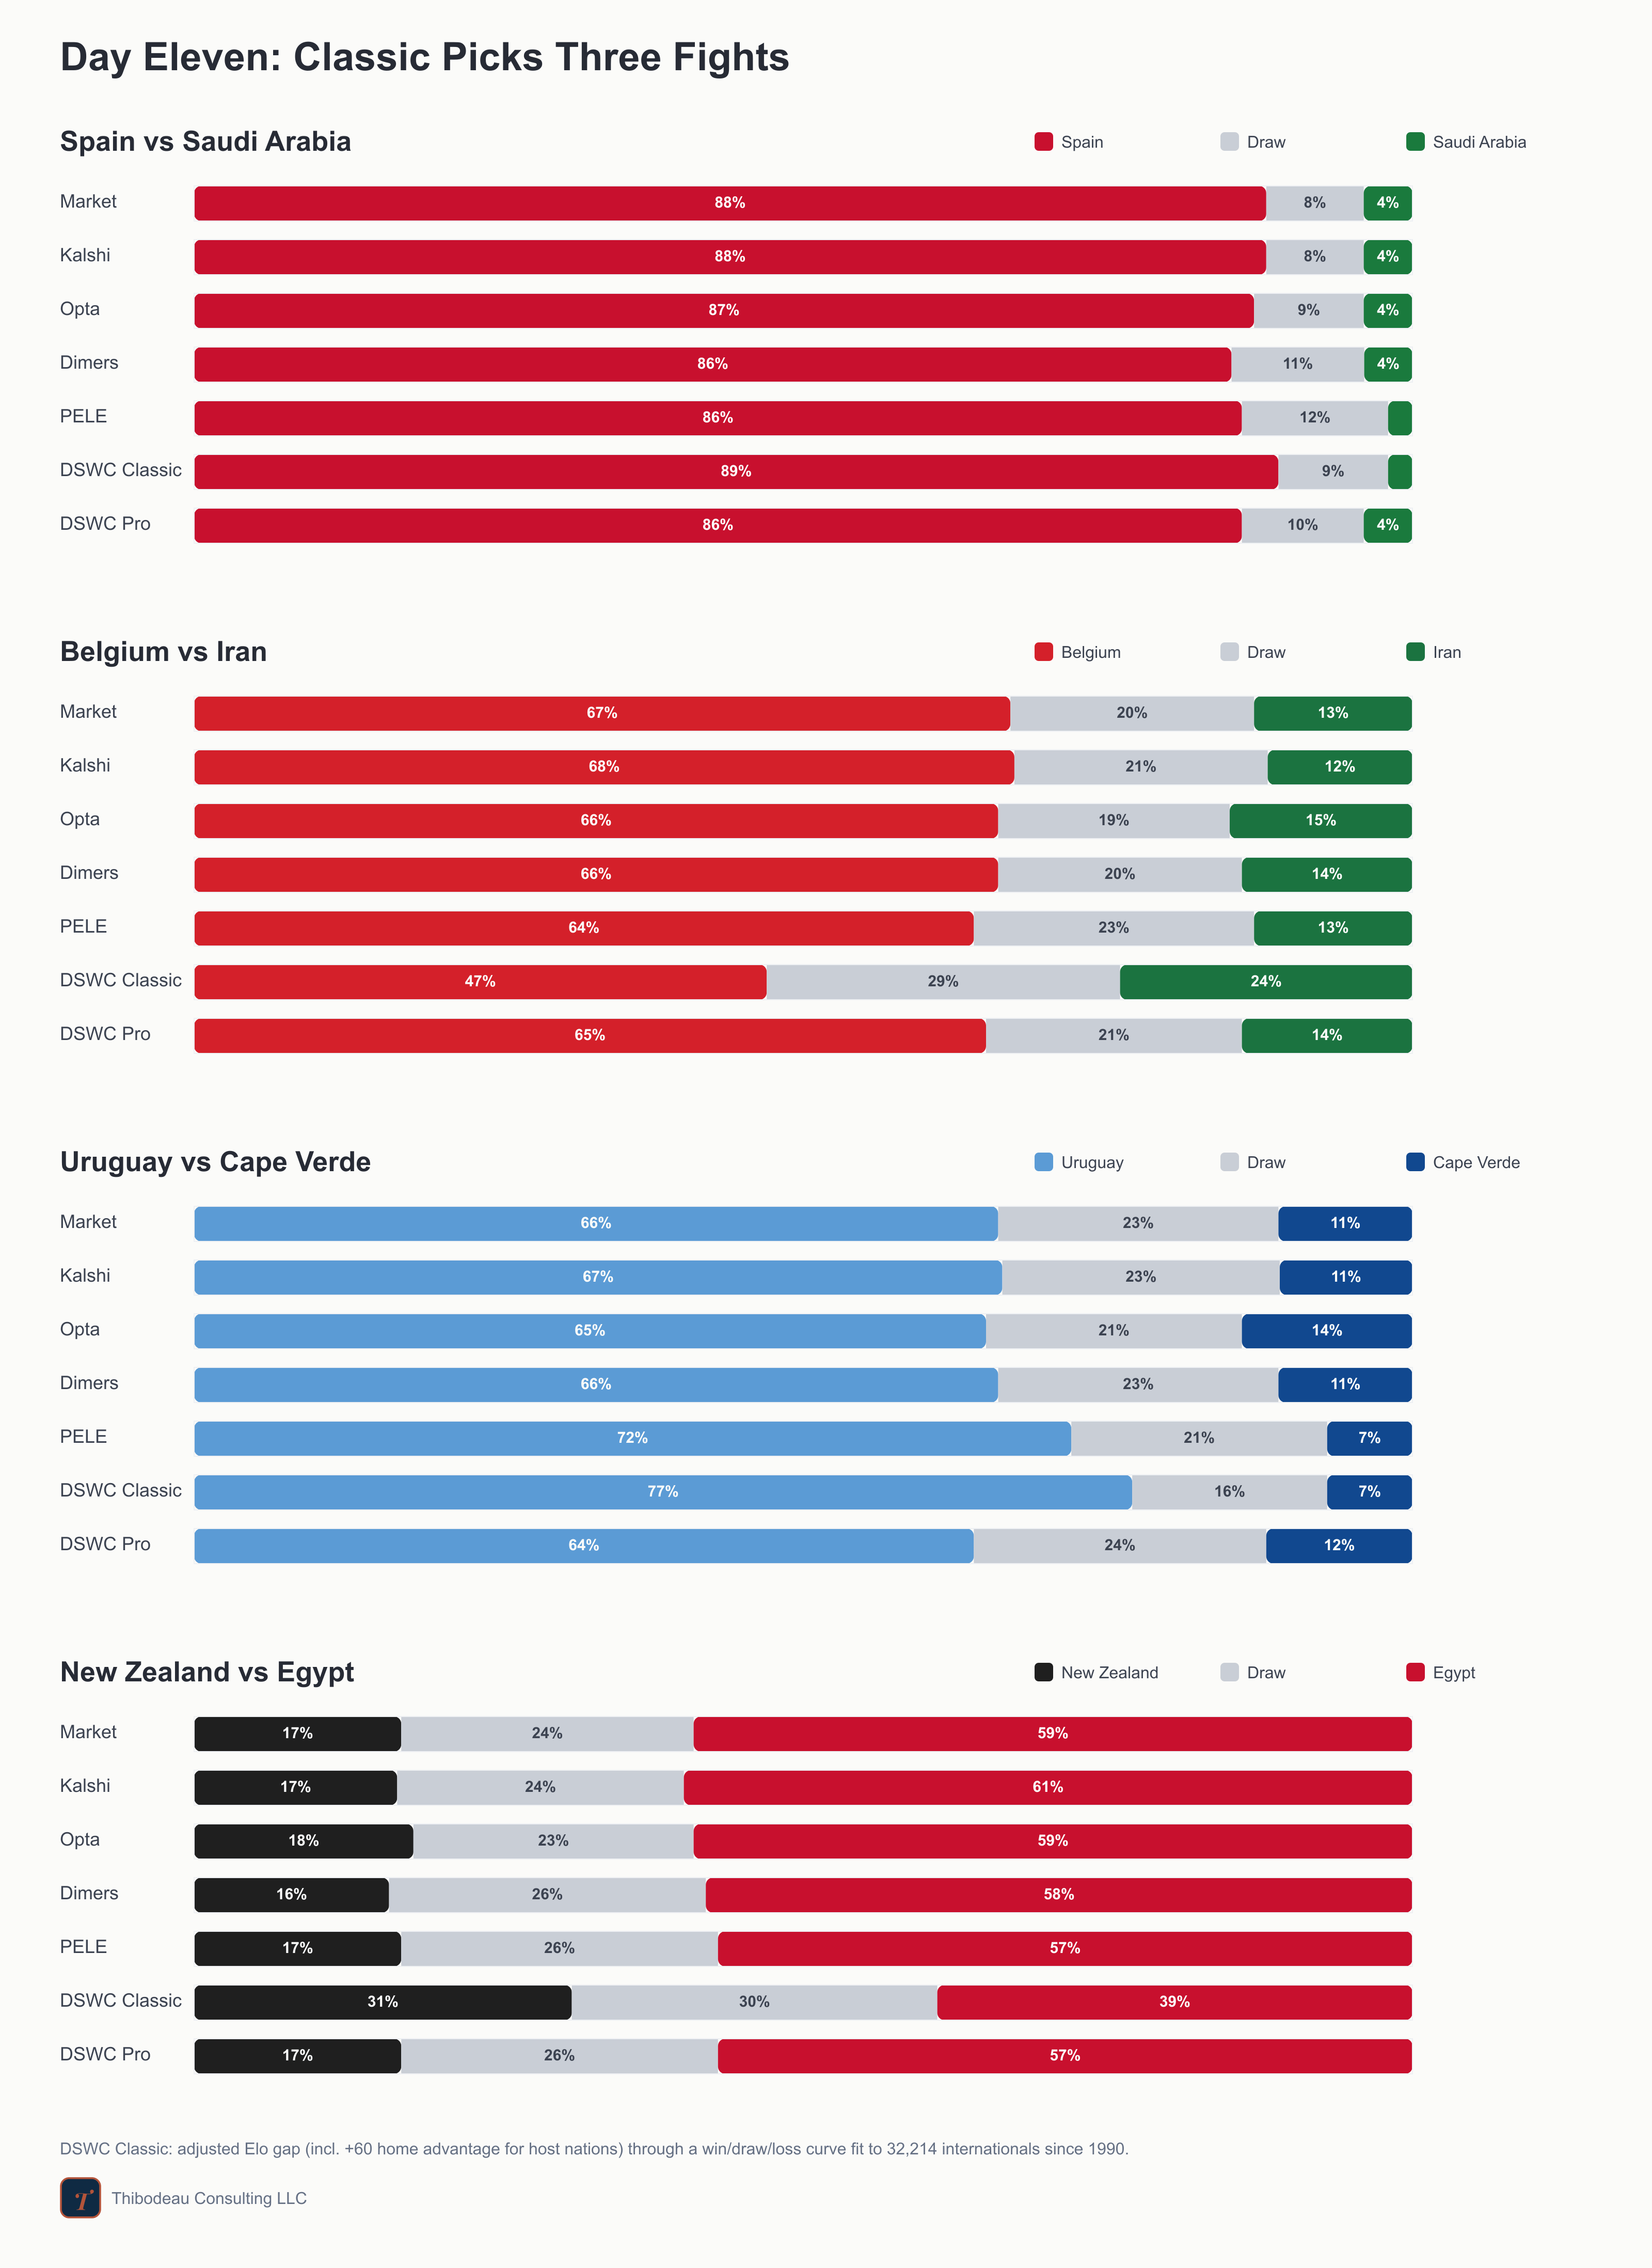
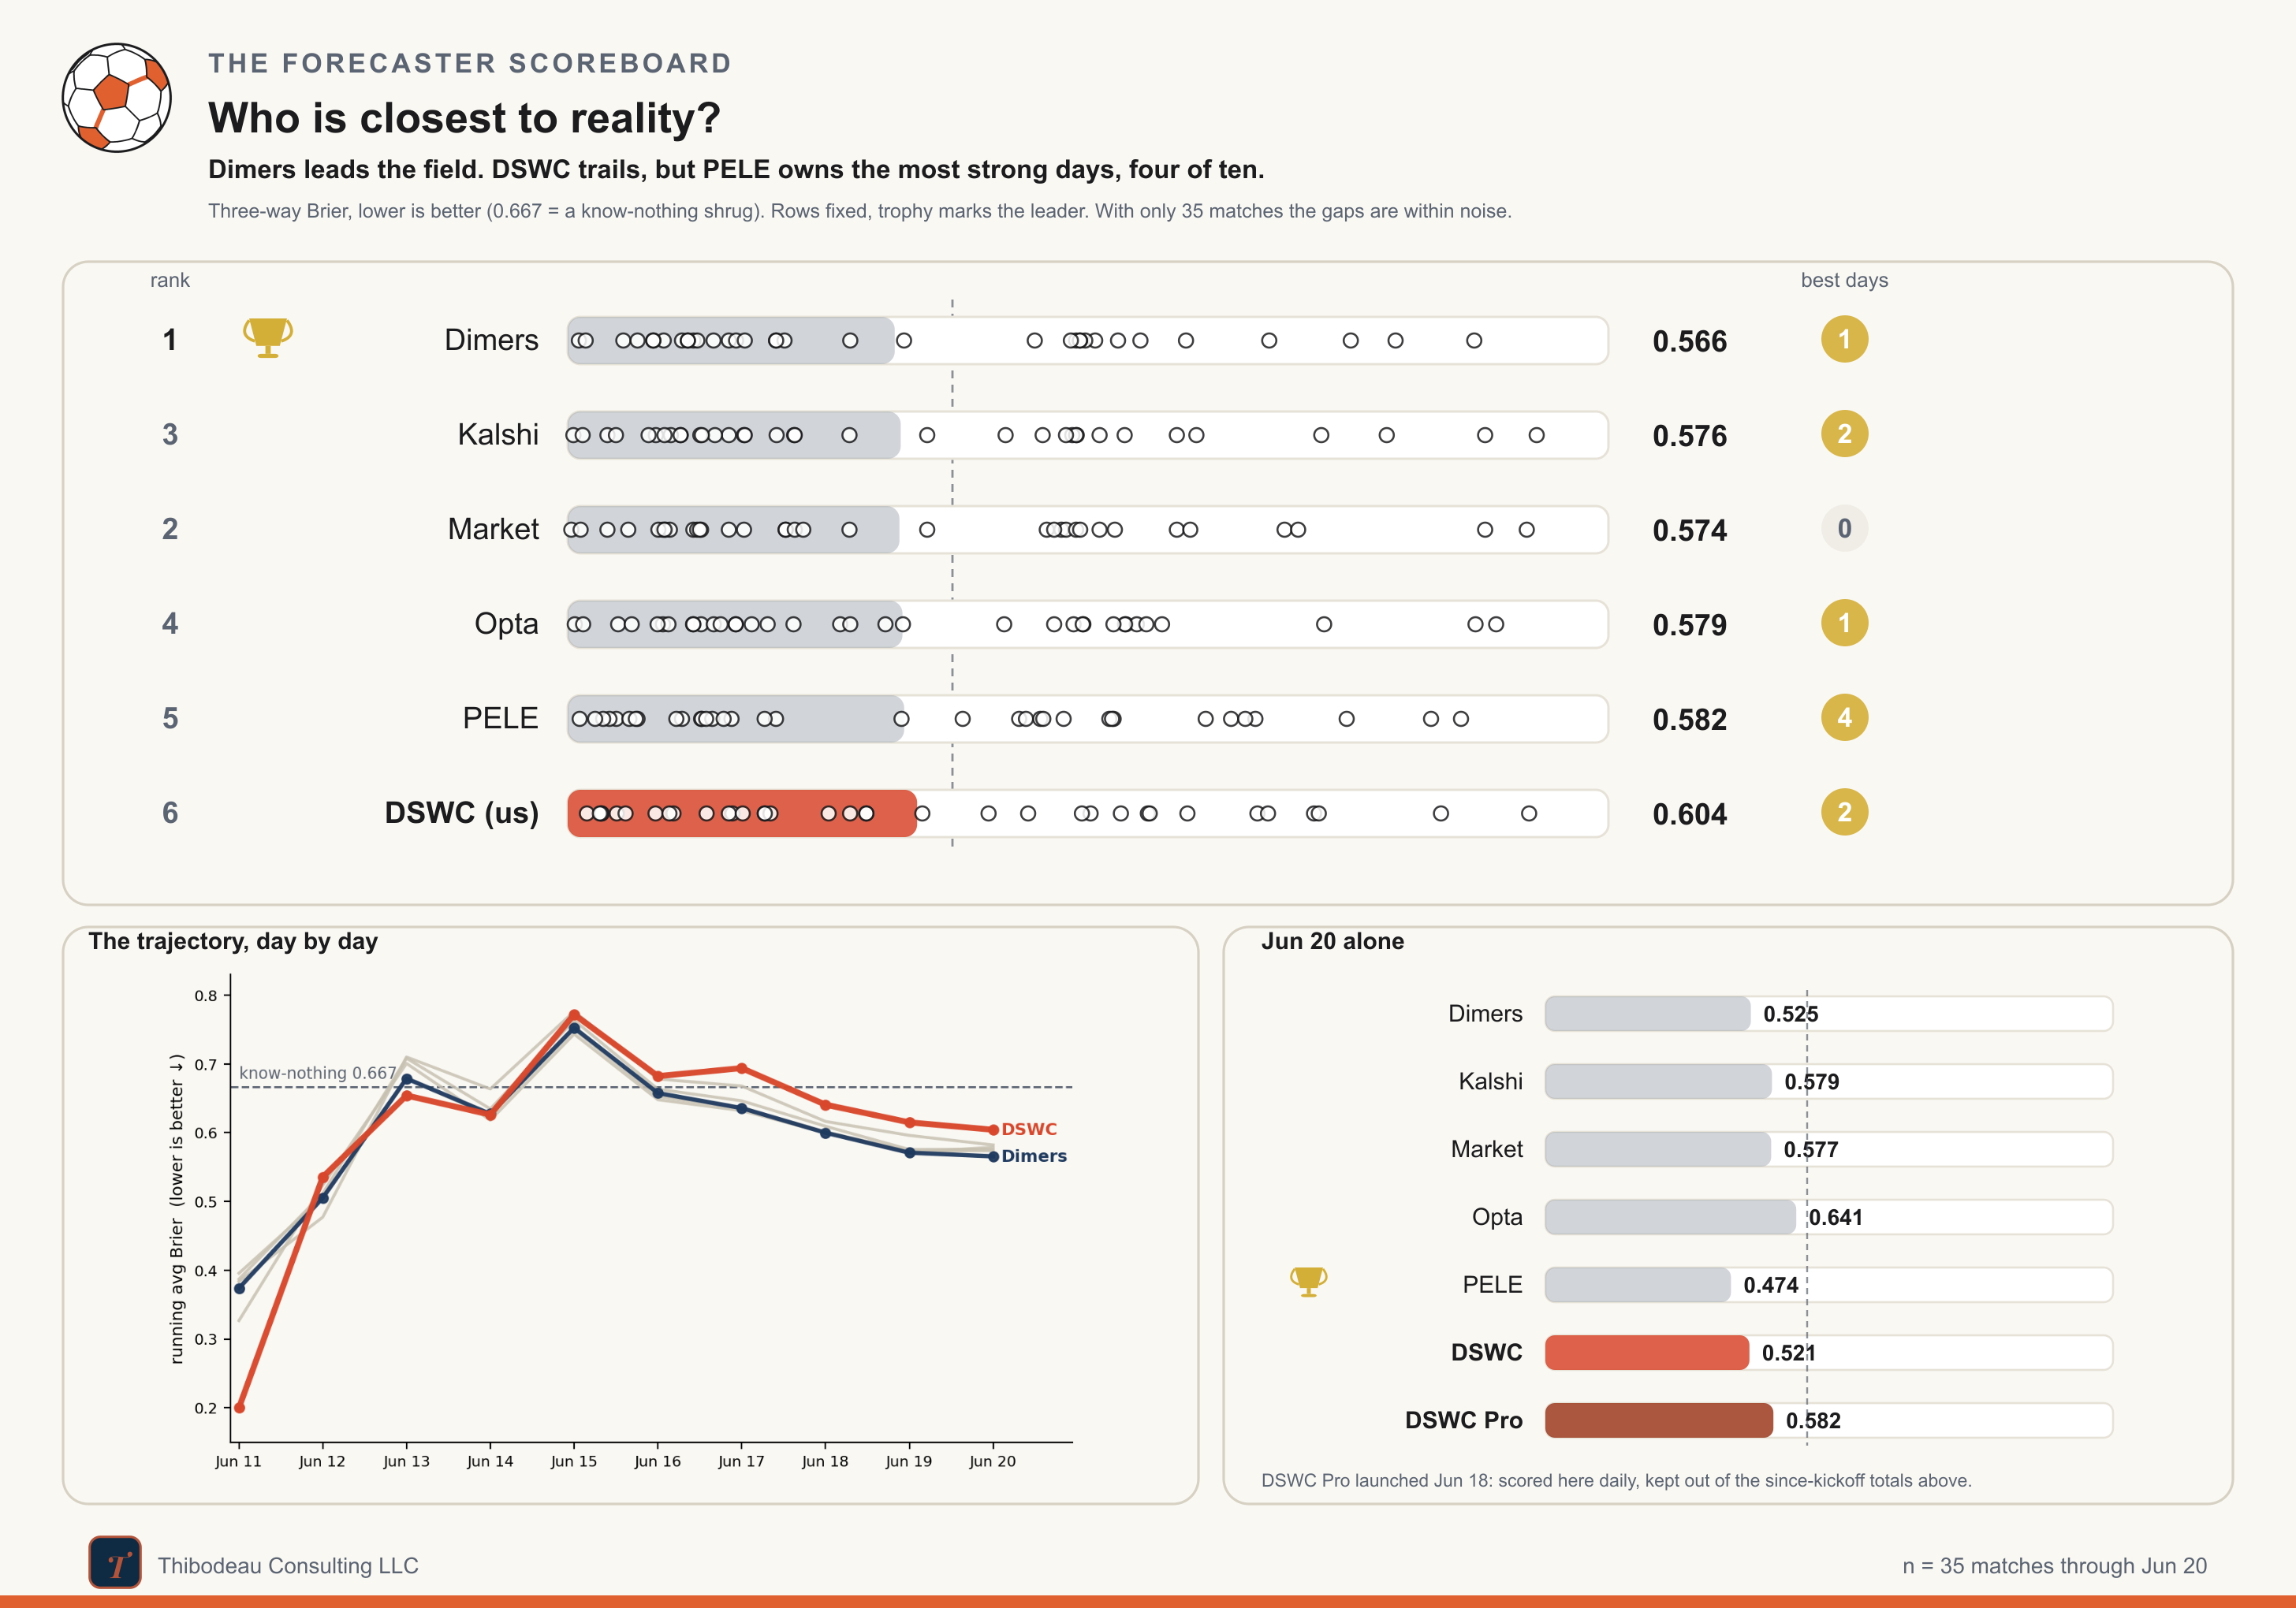
Through 35 matches, Dimers leads at 0.566. The market sits close behind at 0.574, Kalshi at 0.576, Opta at 0.579, PELE at 0.582, and DSWC Classic at 0.604. Everyone is now beating the know-nothing 0.667 line, which is good news for the entire enterprise.
Today’s slate looks straightforward on paper. Spain is nearly unanimous against Saudi Arabia, with everyone between 86 and 89 percent. Uruguay is a solid favorite over Cape Verde, though Classic is hotter than the field at 77 percent while Pro comes back toward the market at 64. Egypt is favored over New Zealand, but Classic again dissents, pulling Egypt down to 39 and giving New Zealand a real chance.
The sharpest disagreement is Belgium-Iran. The market has Belgium at 67 percent. The public models are right around the same place. DSWC Pro agrees. Classic does not: Belgium 47, draw 29, Iran 24. That is exactly the kind of split today’s post is about. Maybe the market is pricing talent and squad value that Classic cannot see. Maybe Classic is finding something in the results ledger. Either way, the line has spoken, the model has objected, and now the game gets to settle the argument.