When the Features Have to Compete
What survives when team quality, form, hosting, experience, and context all enter the model together

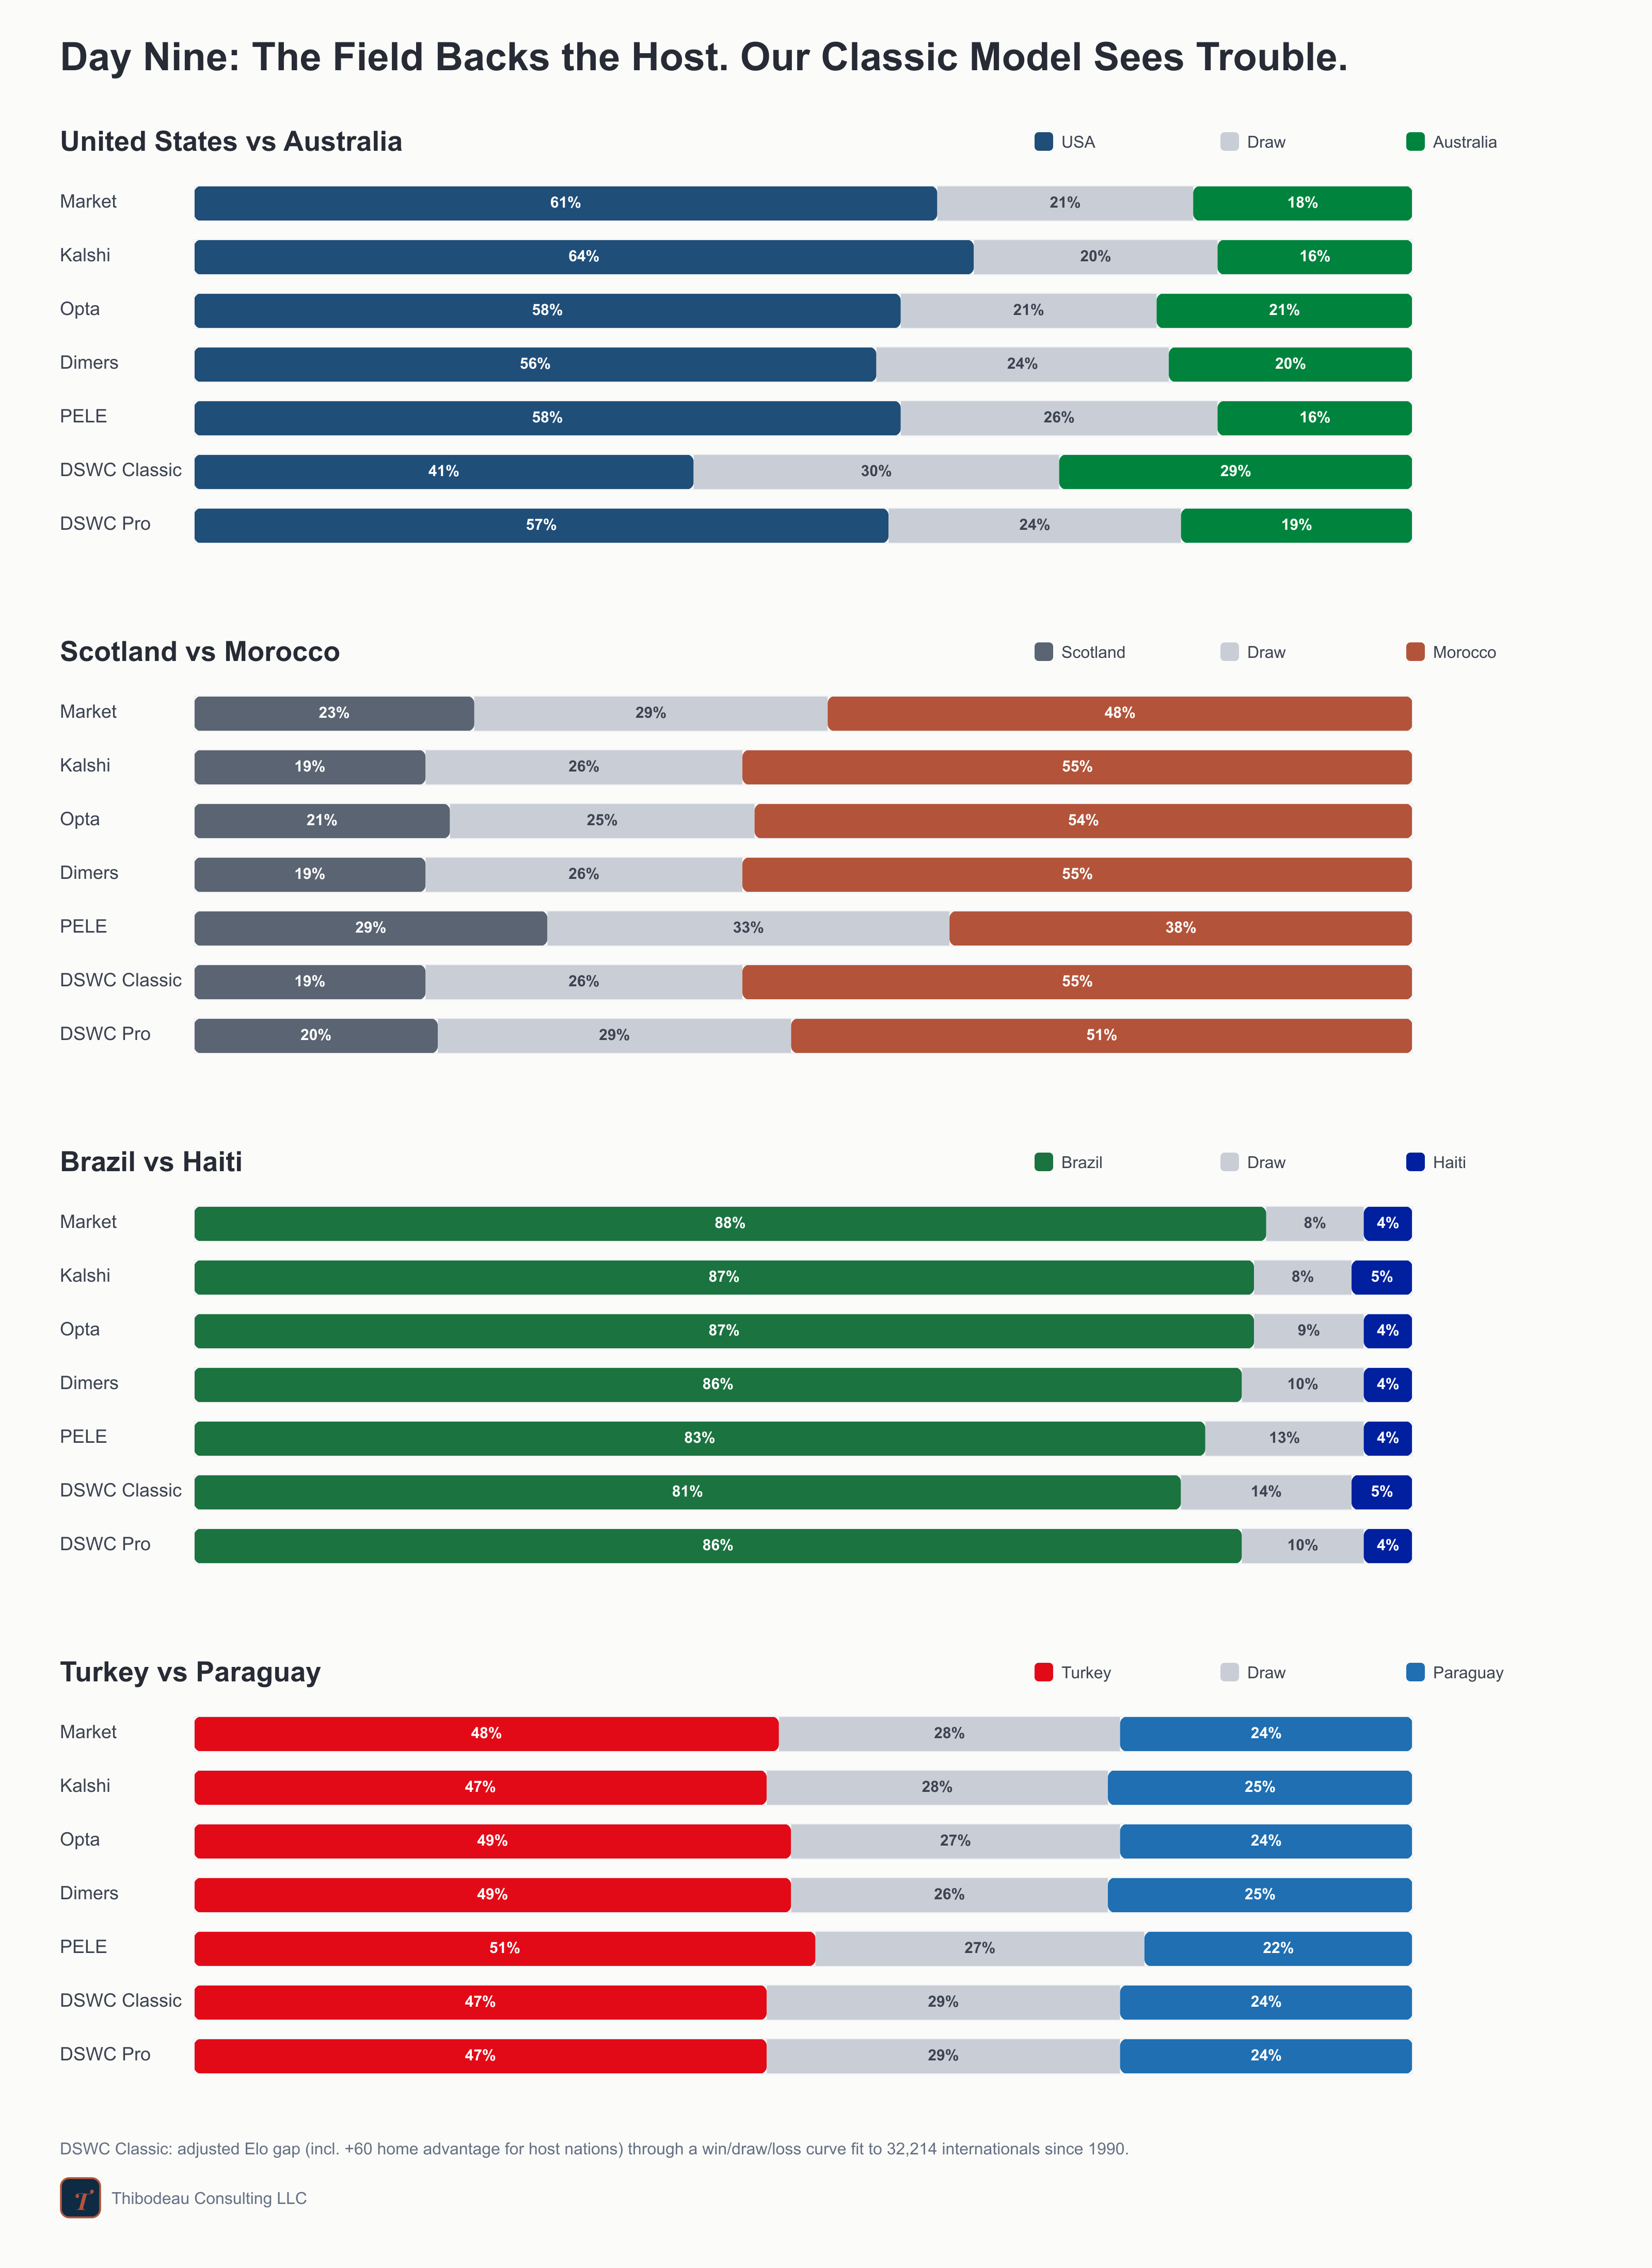
Day nine, and the United States is back. After Canada and Mexico cashed their host bump yesterday, the third host gets the stage again this afternoon in Seattle against Australia. The market, Opta, Dimers, and Kalshi all make the U.S. a clear favorite; our original results-only model is much less convinced. Around that, Scotland-Morocco gives us a clean model split, Brazil-Haiti is the day’s safest chalk, and Turkey-Paraguay closes the night as a true toss-up. Today we finally put the features in one model and ask what survives when they have to compete. But first, a quick recap.
Previously, at the World Cup
Day eight mostly restored order, and the hosts did their part. Switzerland beat Bosnia and Herzegovina 4-1, Canada flattened Qatar 6-0 behind a Jonathan David hat trick, and Mexico edged South Korea 1-0 in Guadalajara. The only blemish for the chalk was Czechia, which let South Africa escape with a 1-1 draw after a late penalty. For a tournament that spent the first week punishing confidence, this was a calmer day: three favorites landed, two hosts strengthened their position, and our results-only model finally got rewarded for leaning hard into Switzerland, Canada, and Mexico. The scoreboard at the bottom updated accordingly.
Question 9: What happens when the features have to compete?
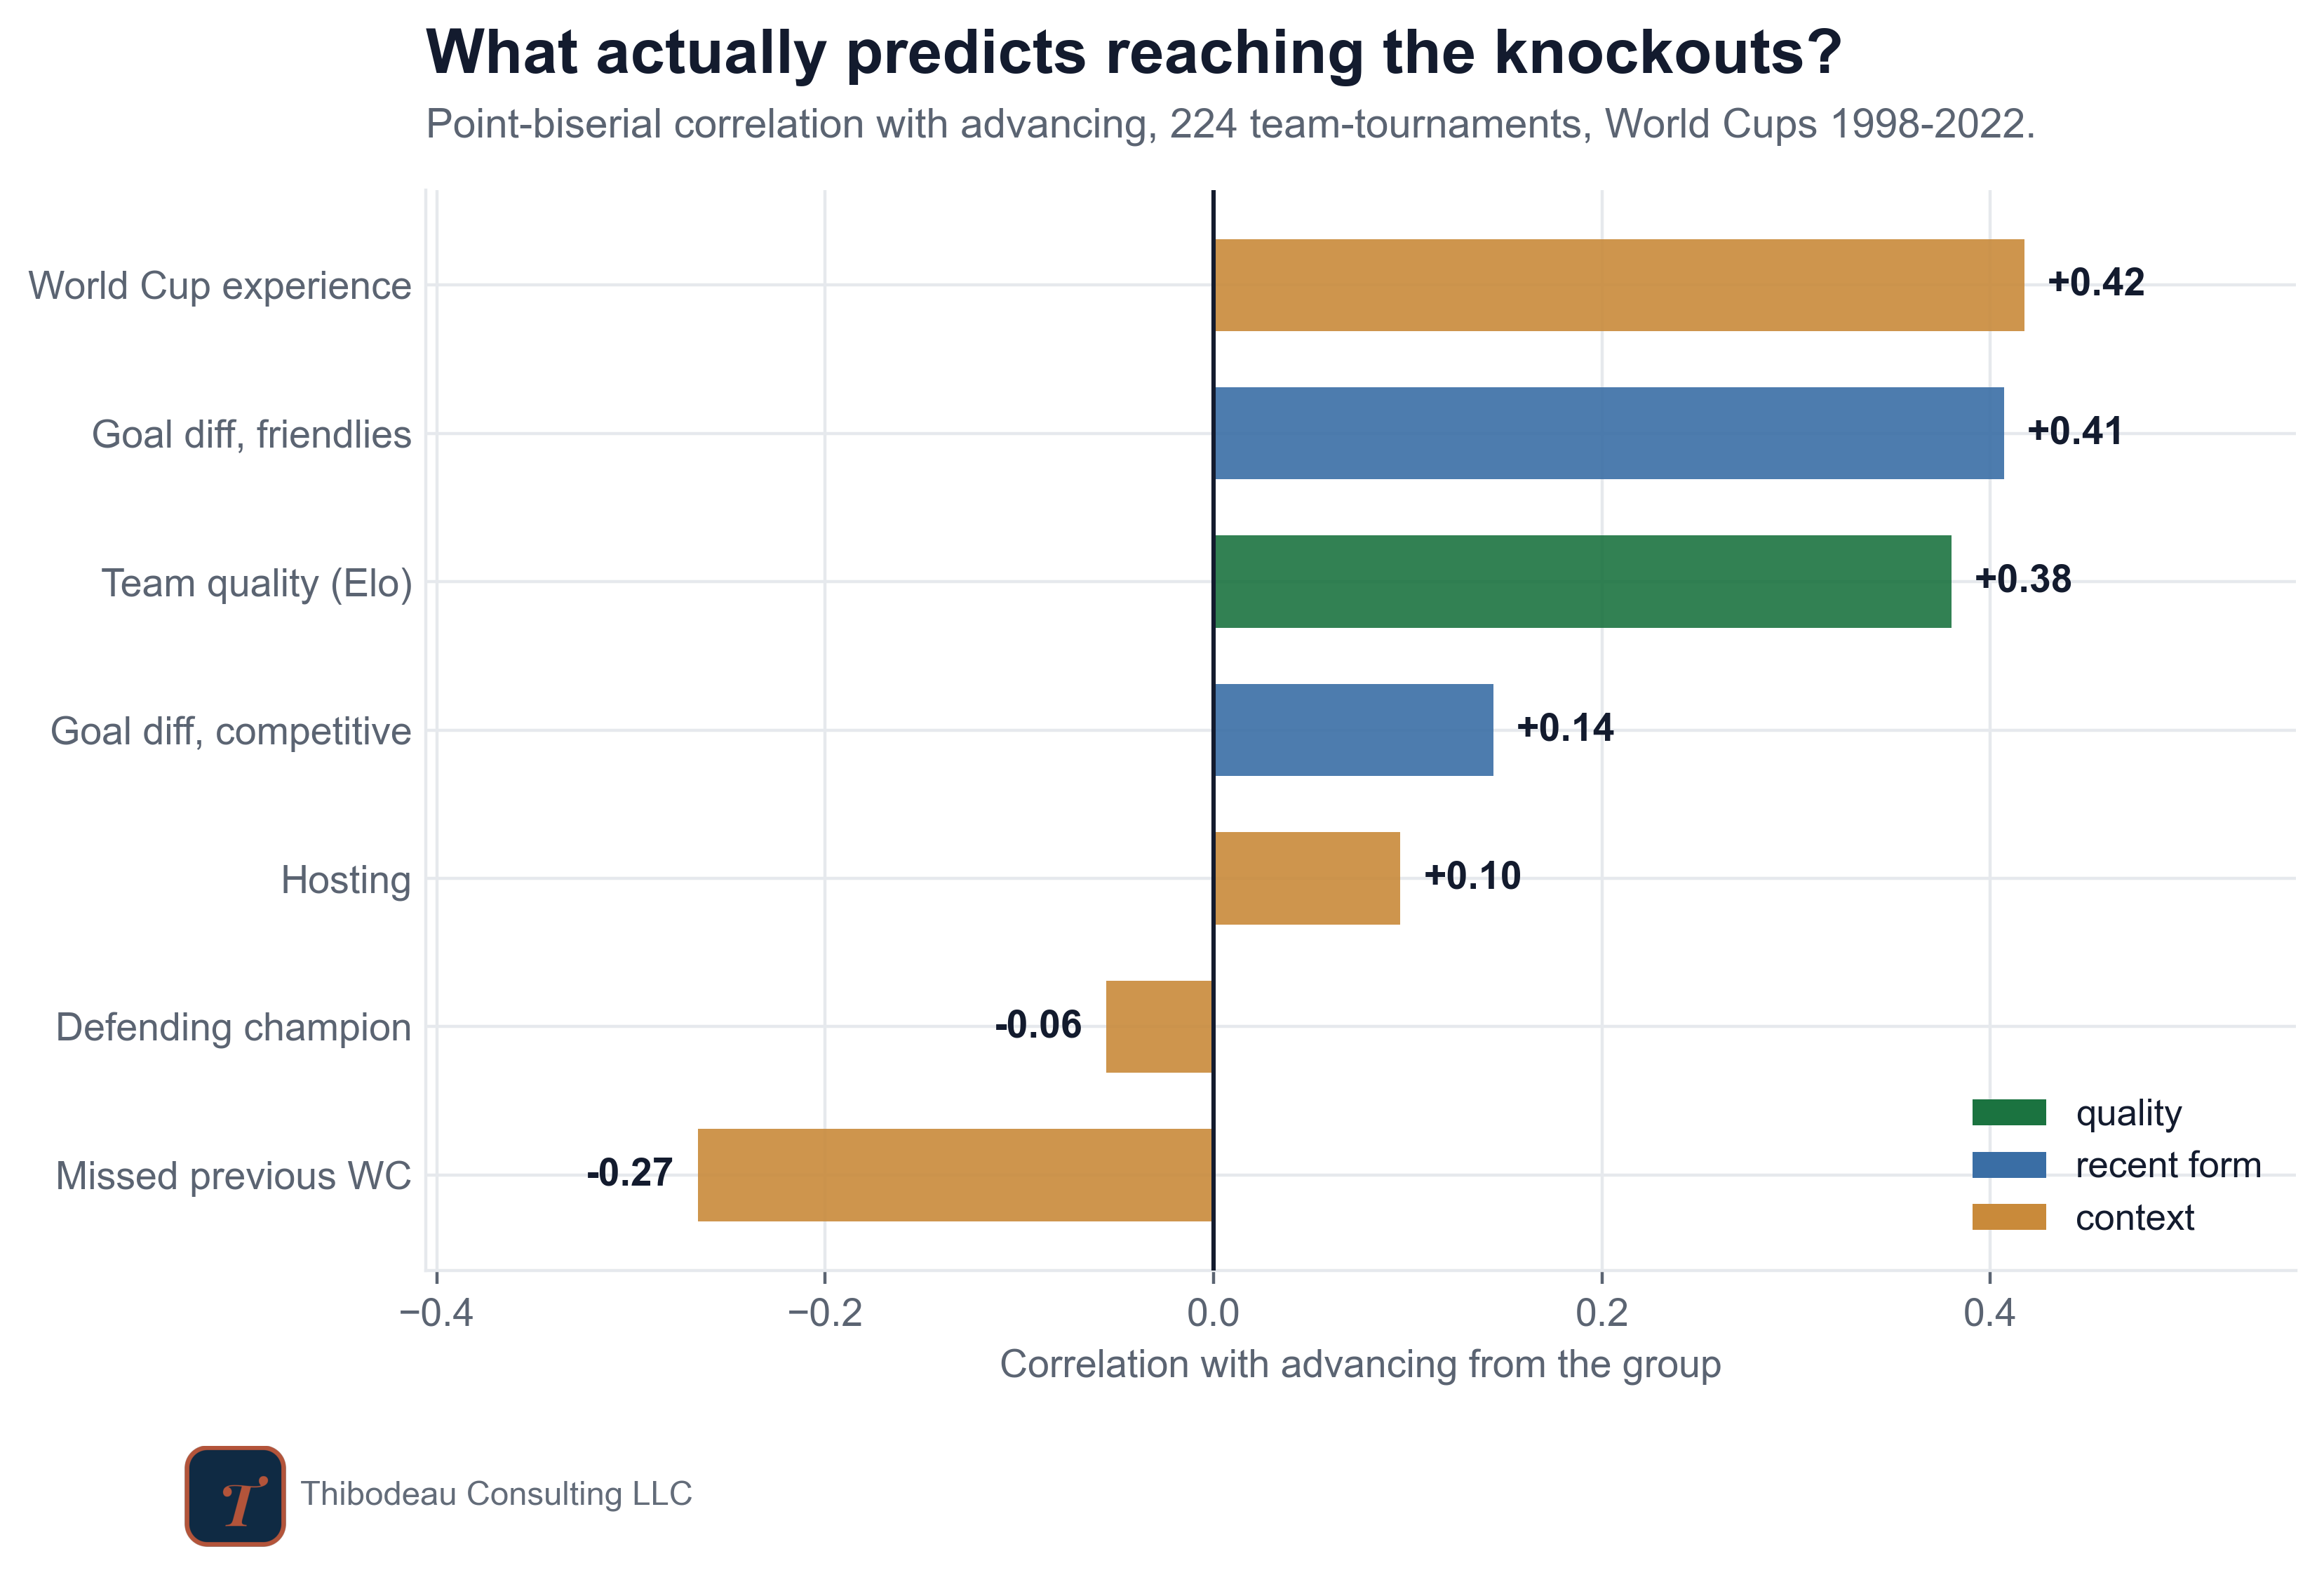
So far, we have analyzed the predictors one at a time. Team quality looked sturdy. Recent competitive form looked shaky. Friendly form looked surprisingly useful. World Cup experience looked powerful, but suspiciously redundant. Missing the last tournament looked like a warning sign, as did winning it. Confederation looked like a check on whether ratings travel cleanly across regions. Hosting looked like the cleanest structural bump on the board.
Now we need to figure out how to weigh them together. Teams enter the World Cup with all of these facts attached at once. Spain is not just highly rated. It is highly rated, experienced, European, recently successful, and surrounded by expectations. Canada is not just a host. It is a host with a rating, a confederation, a recent record, a tournament history, and a draw.
Let’s jump in. First, I’ll describe what the model found; then, how the model found it.
The Best Fit
The coefficient chart shows what survives when all the features compete at once. Each dot is the model’s best estimate for a feature’s effect on reaching the knockouts, after accounting for the others. Dots to the right help; dots to the left hurt. The horizontal lines show uncertainty. Green and red features are the ones the model is most confident about; grey features are still within the noise.
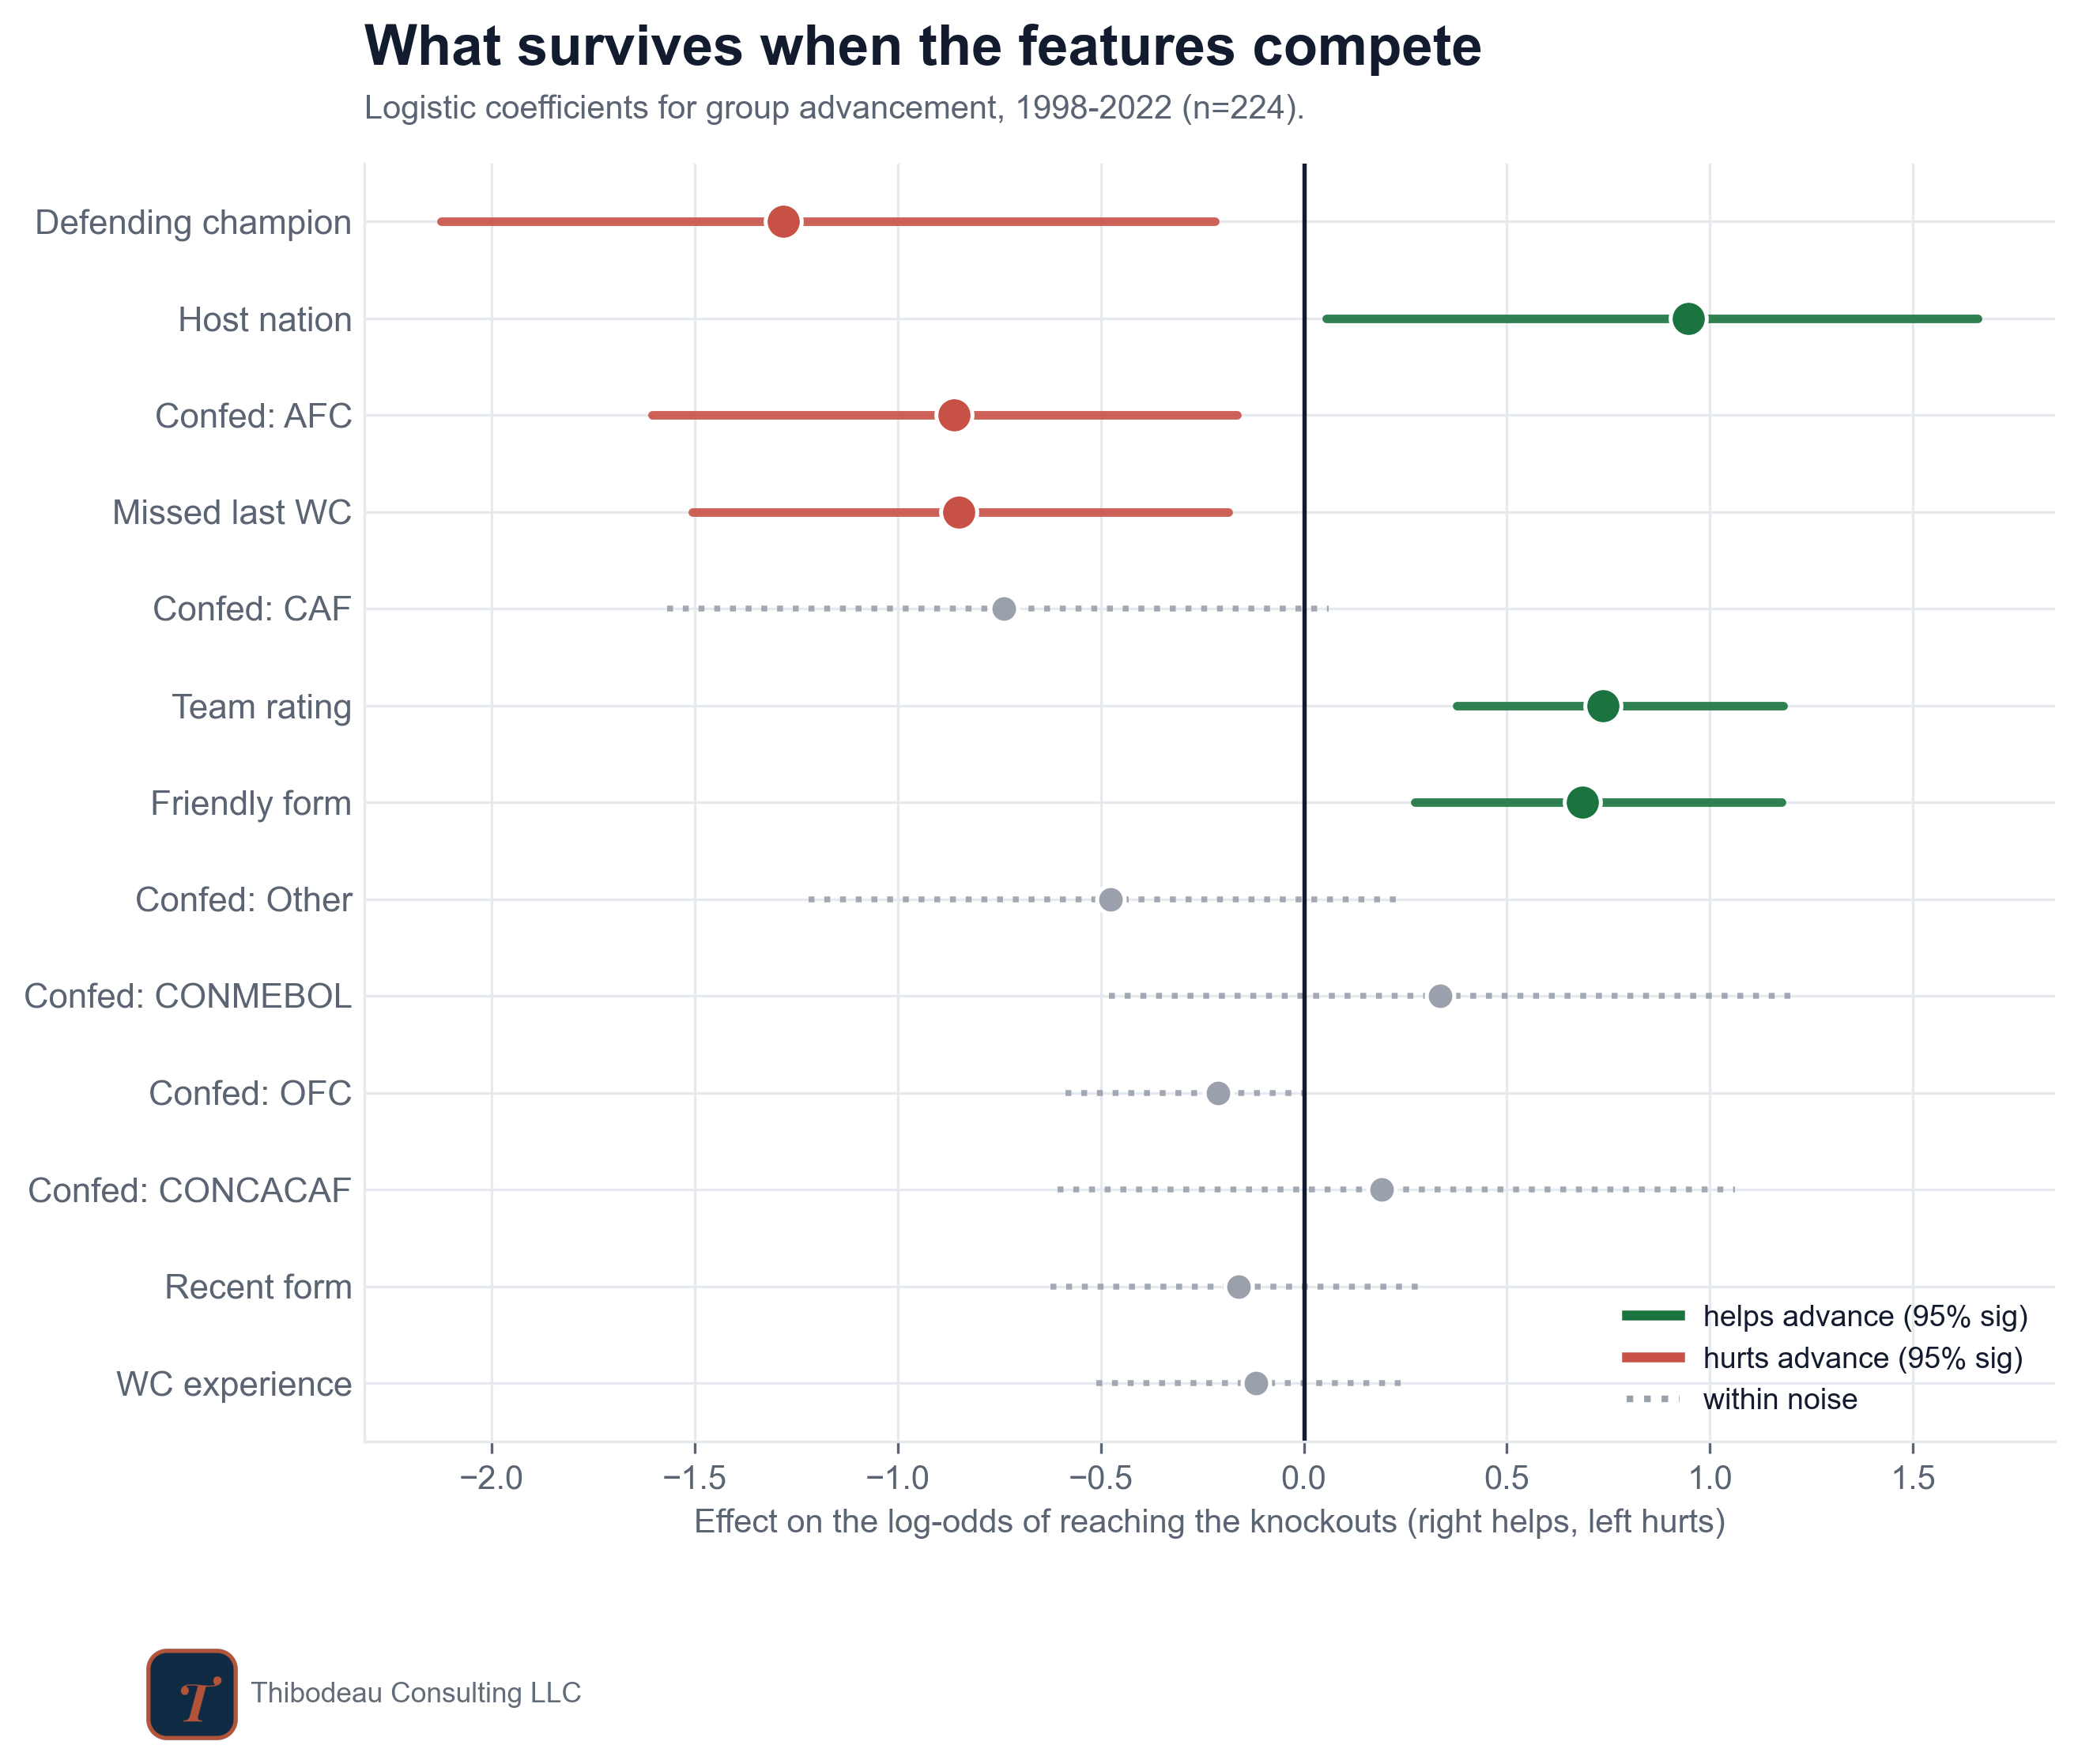
The first thing to notice is that the team quality rating is still the backbone. The width of the horizontal “uncertainty line” for that feature is narrower than the rest. If you know nothing else about a team, start with that.
But the team quality rating is not the only impactful feature. Hosting also shows up as a large positive push, though with a wide interval because there have been so few hosts. Friendly form survives too, while recent competitive form fades almost completely. That matches what we saw earlier: the games that “don’t count” may carry more new information than the qualifiers everyone takes seriously.
On the negative side, missing the previous World Cup still hurts. Confederation is also informative for teams from Asia, which have been a little less likely to advance than the model would expect given the other information. The loudest negative signal in the room is defending champion. The model gives the holders a large negative adjustment even after accounting for how good they are. That is the champion’s hangover from earlier in the week, and it does not disappear when the other features enter. Whatever the crown carries, whether aging, pressure, regression to the mean, or stale expectations, the team quality rating does not fully explain it.
How it Works
The reason we need a model is information overlap. World Cup experience predicts advancement, but experienced teams are usually strong teams. Friendly goal difference predicts advancement, but good teams tend to win friendlies too. Confederation predicts advancement, but confederations do not send equally strong teams. If we look at the features one at a time, we may be seeing the same information repeated under different names.
The model asks the harder question: once team quality is known, does experience still help?
Fitting the Model
The specific model I used is logistic regression. That sounds technical, but the job is simple: predict a two-sided outcome. Advance or go home. Yes or no. True or false. Logistic regression takes a set of inputs and turns them into a probability. In our case, the output is the probability that a team reaches the knockouts.
To fit the model, we give it historical examples. Each row is one team in one World Cup from 1998 through 2022. The model sees the team’s pre-tournament rating, form, hosting status, World Cup history, confederation, and whether it actually advanced. Then it learns a weight for each feature: how much that feature tends to push teams toward or away from the knockouts, after accounting for the others.
That “after accounting for the others” is the key. The model is not asking whether experienced teams advance more often. It is asking whether knowing a team’s experience adds anything once rating, form, hosting, and context are already known.
The next plot shows that move directly. The left side is the audition: how each feature looks when it gets judged alone. The right side is the final cast: how much that feature matters in the full model, once the others are included.
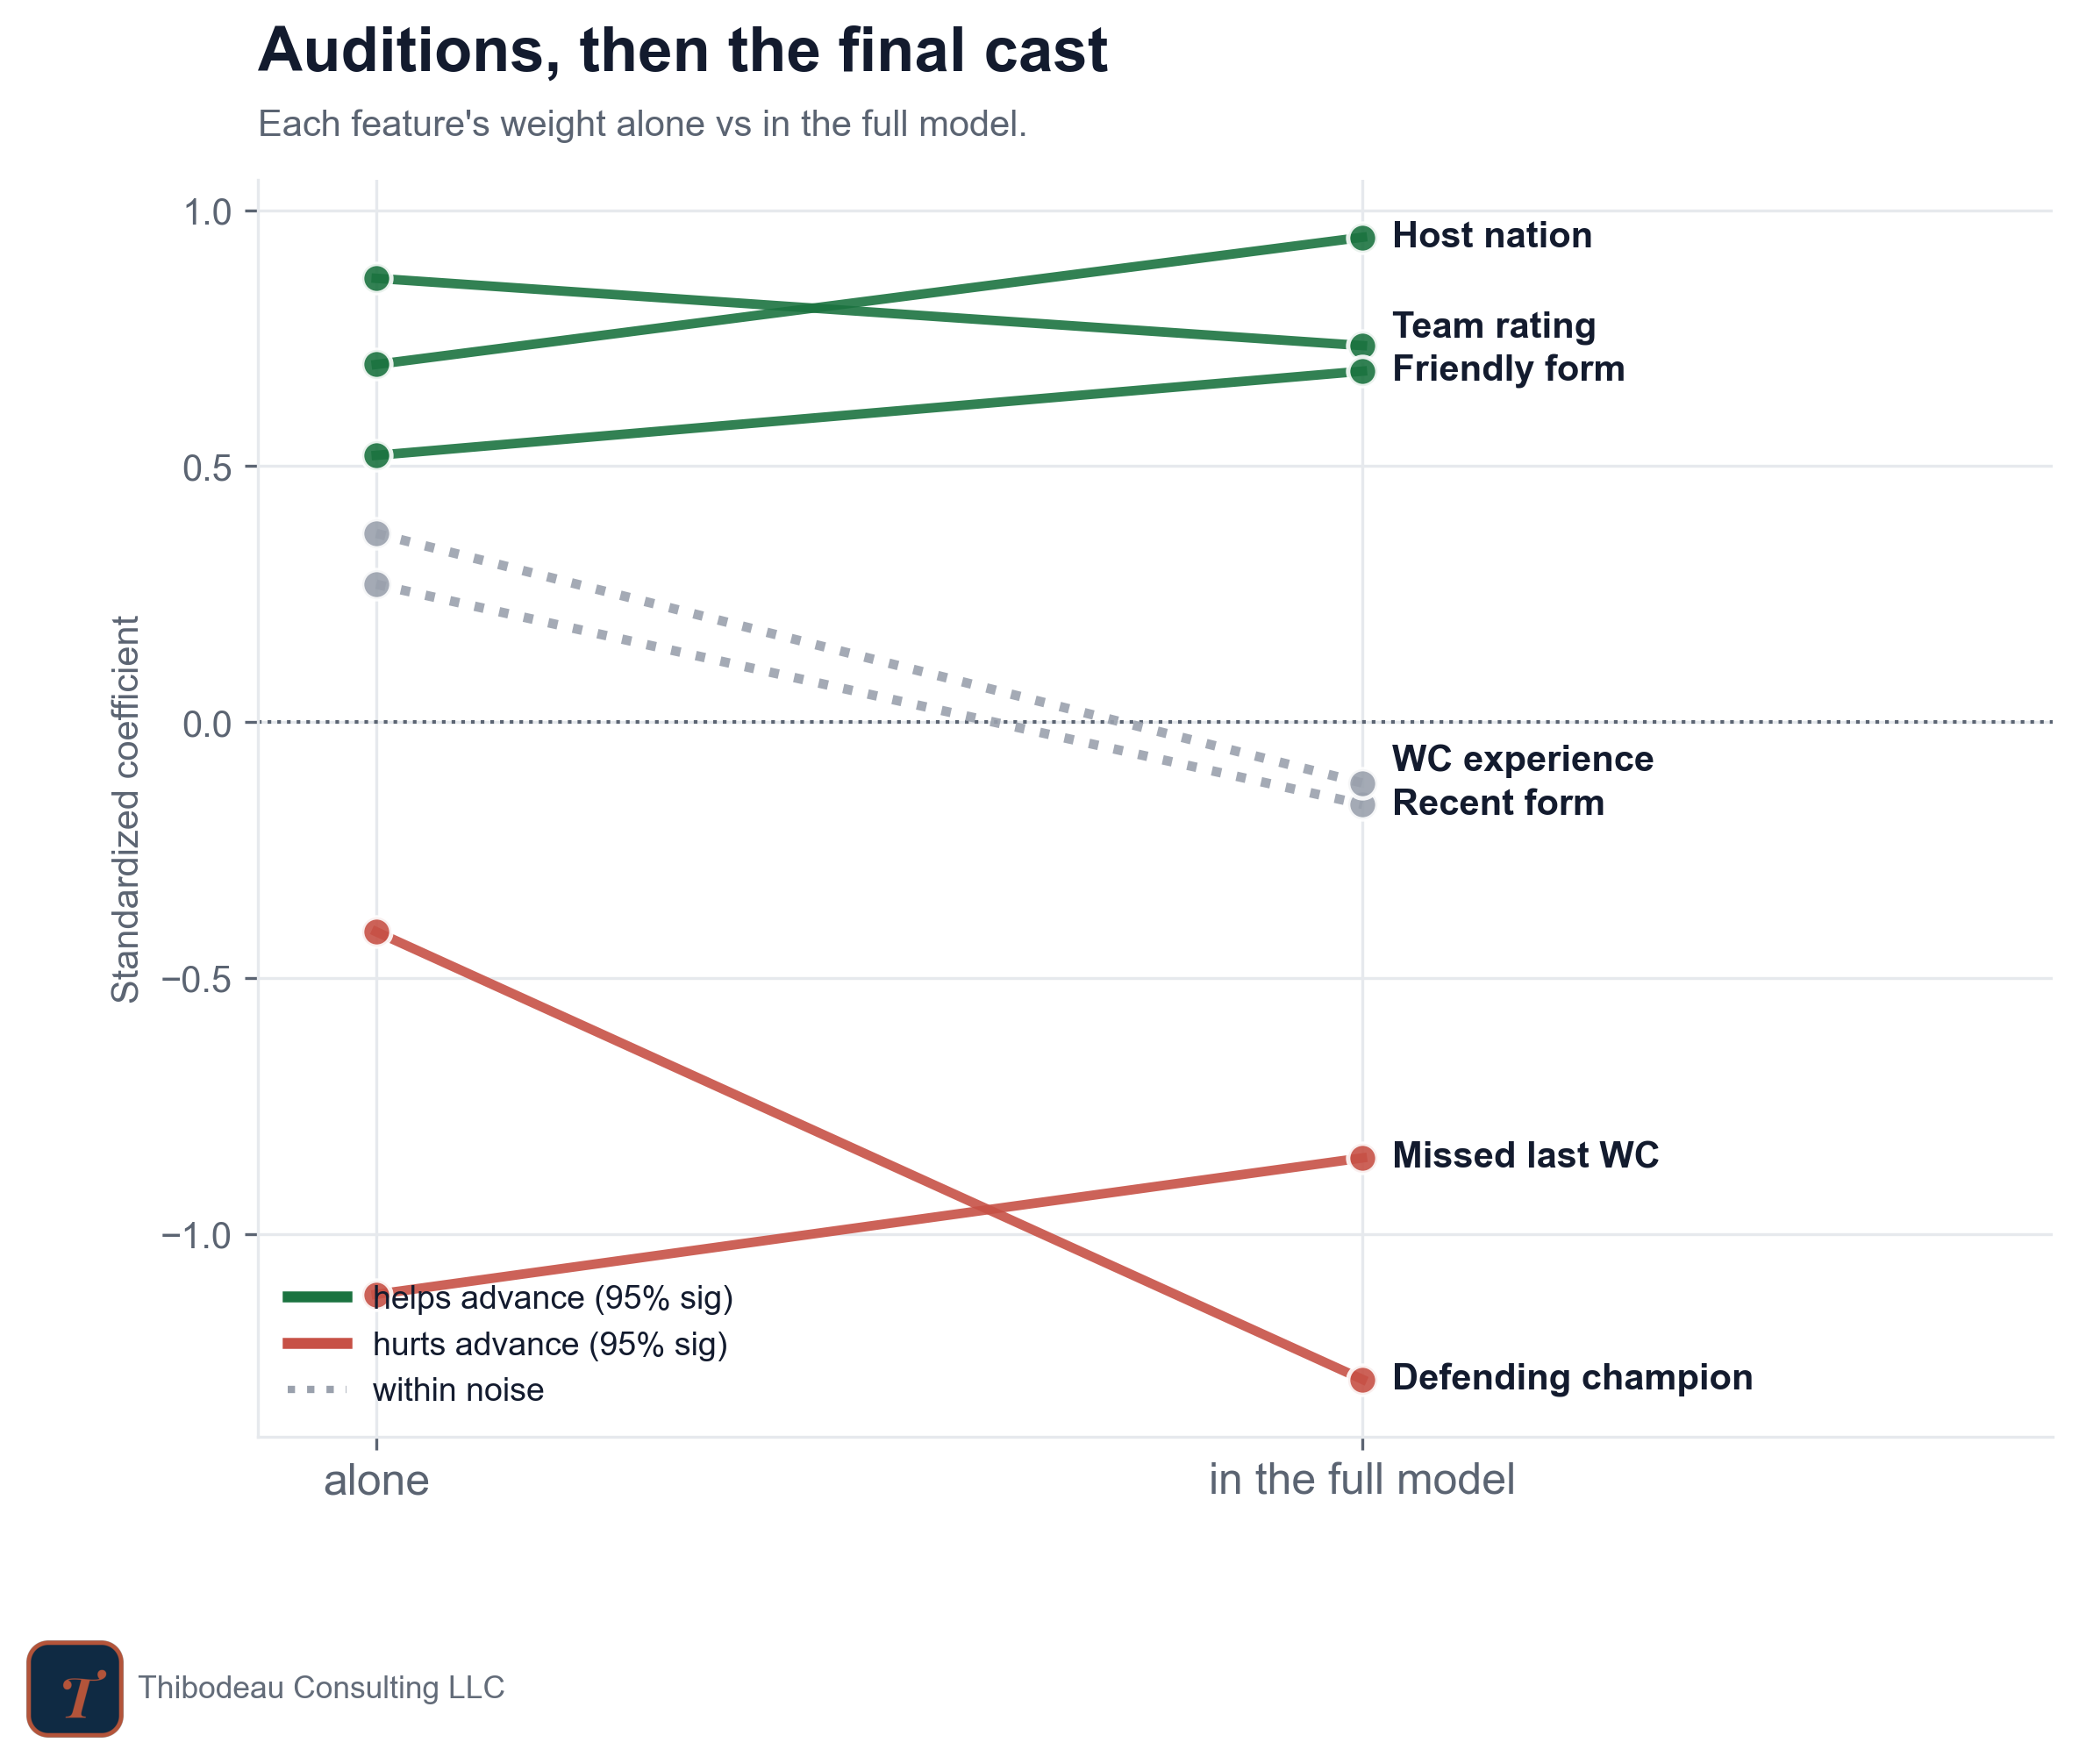
Some features keep their role. Team rating stays positive. Hosting stays positive. Friendly form stays positive. Missing the previous World Cup stays negative. Those features were not just telling us something obvious; they still carry information after the model knows the rest.
Other features shrink. World Cup experience looks useful on its own, but fades in the full model because experienced teams are usually strong teams. Recent form does the same. It was not useless, exactly. It was mostly repeating information the rating already captured.
And then one feature gets louder: defending champion. On its own, the penalty is visible. In the full model, it becomes even larger. That is the model saying the champion’s hangover is not just “champions are secretly weaker teams.” It really shows up after team quality is taken into account.
Making Predictions with the Model
Once the model has learned the weights, making a prediction is mechanical: start with a baseline team, add the feature pushes, and convert the total into a probability.
The next figure walks through that process for two teams. The USA and Spain end up with almost the same chance of reaching the knockouts: 82 percent for the USA, 83 percent for Spain. But the receipts show that those probabilities are built from very different machinery.
For the USA, one line does most of the work: hosting. The team-quality line is basically flat because the USA’s Elo is close to the tournament average. The model is not saying the USA is elite. It is saying the USA is a host, and hosts get structural help.
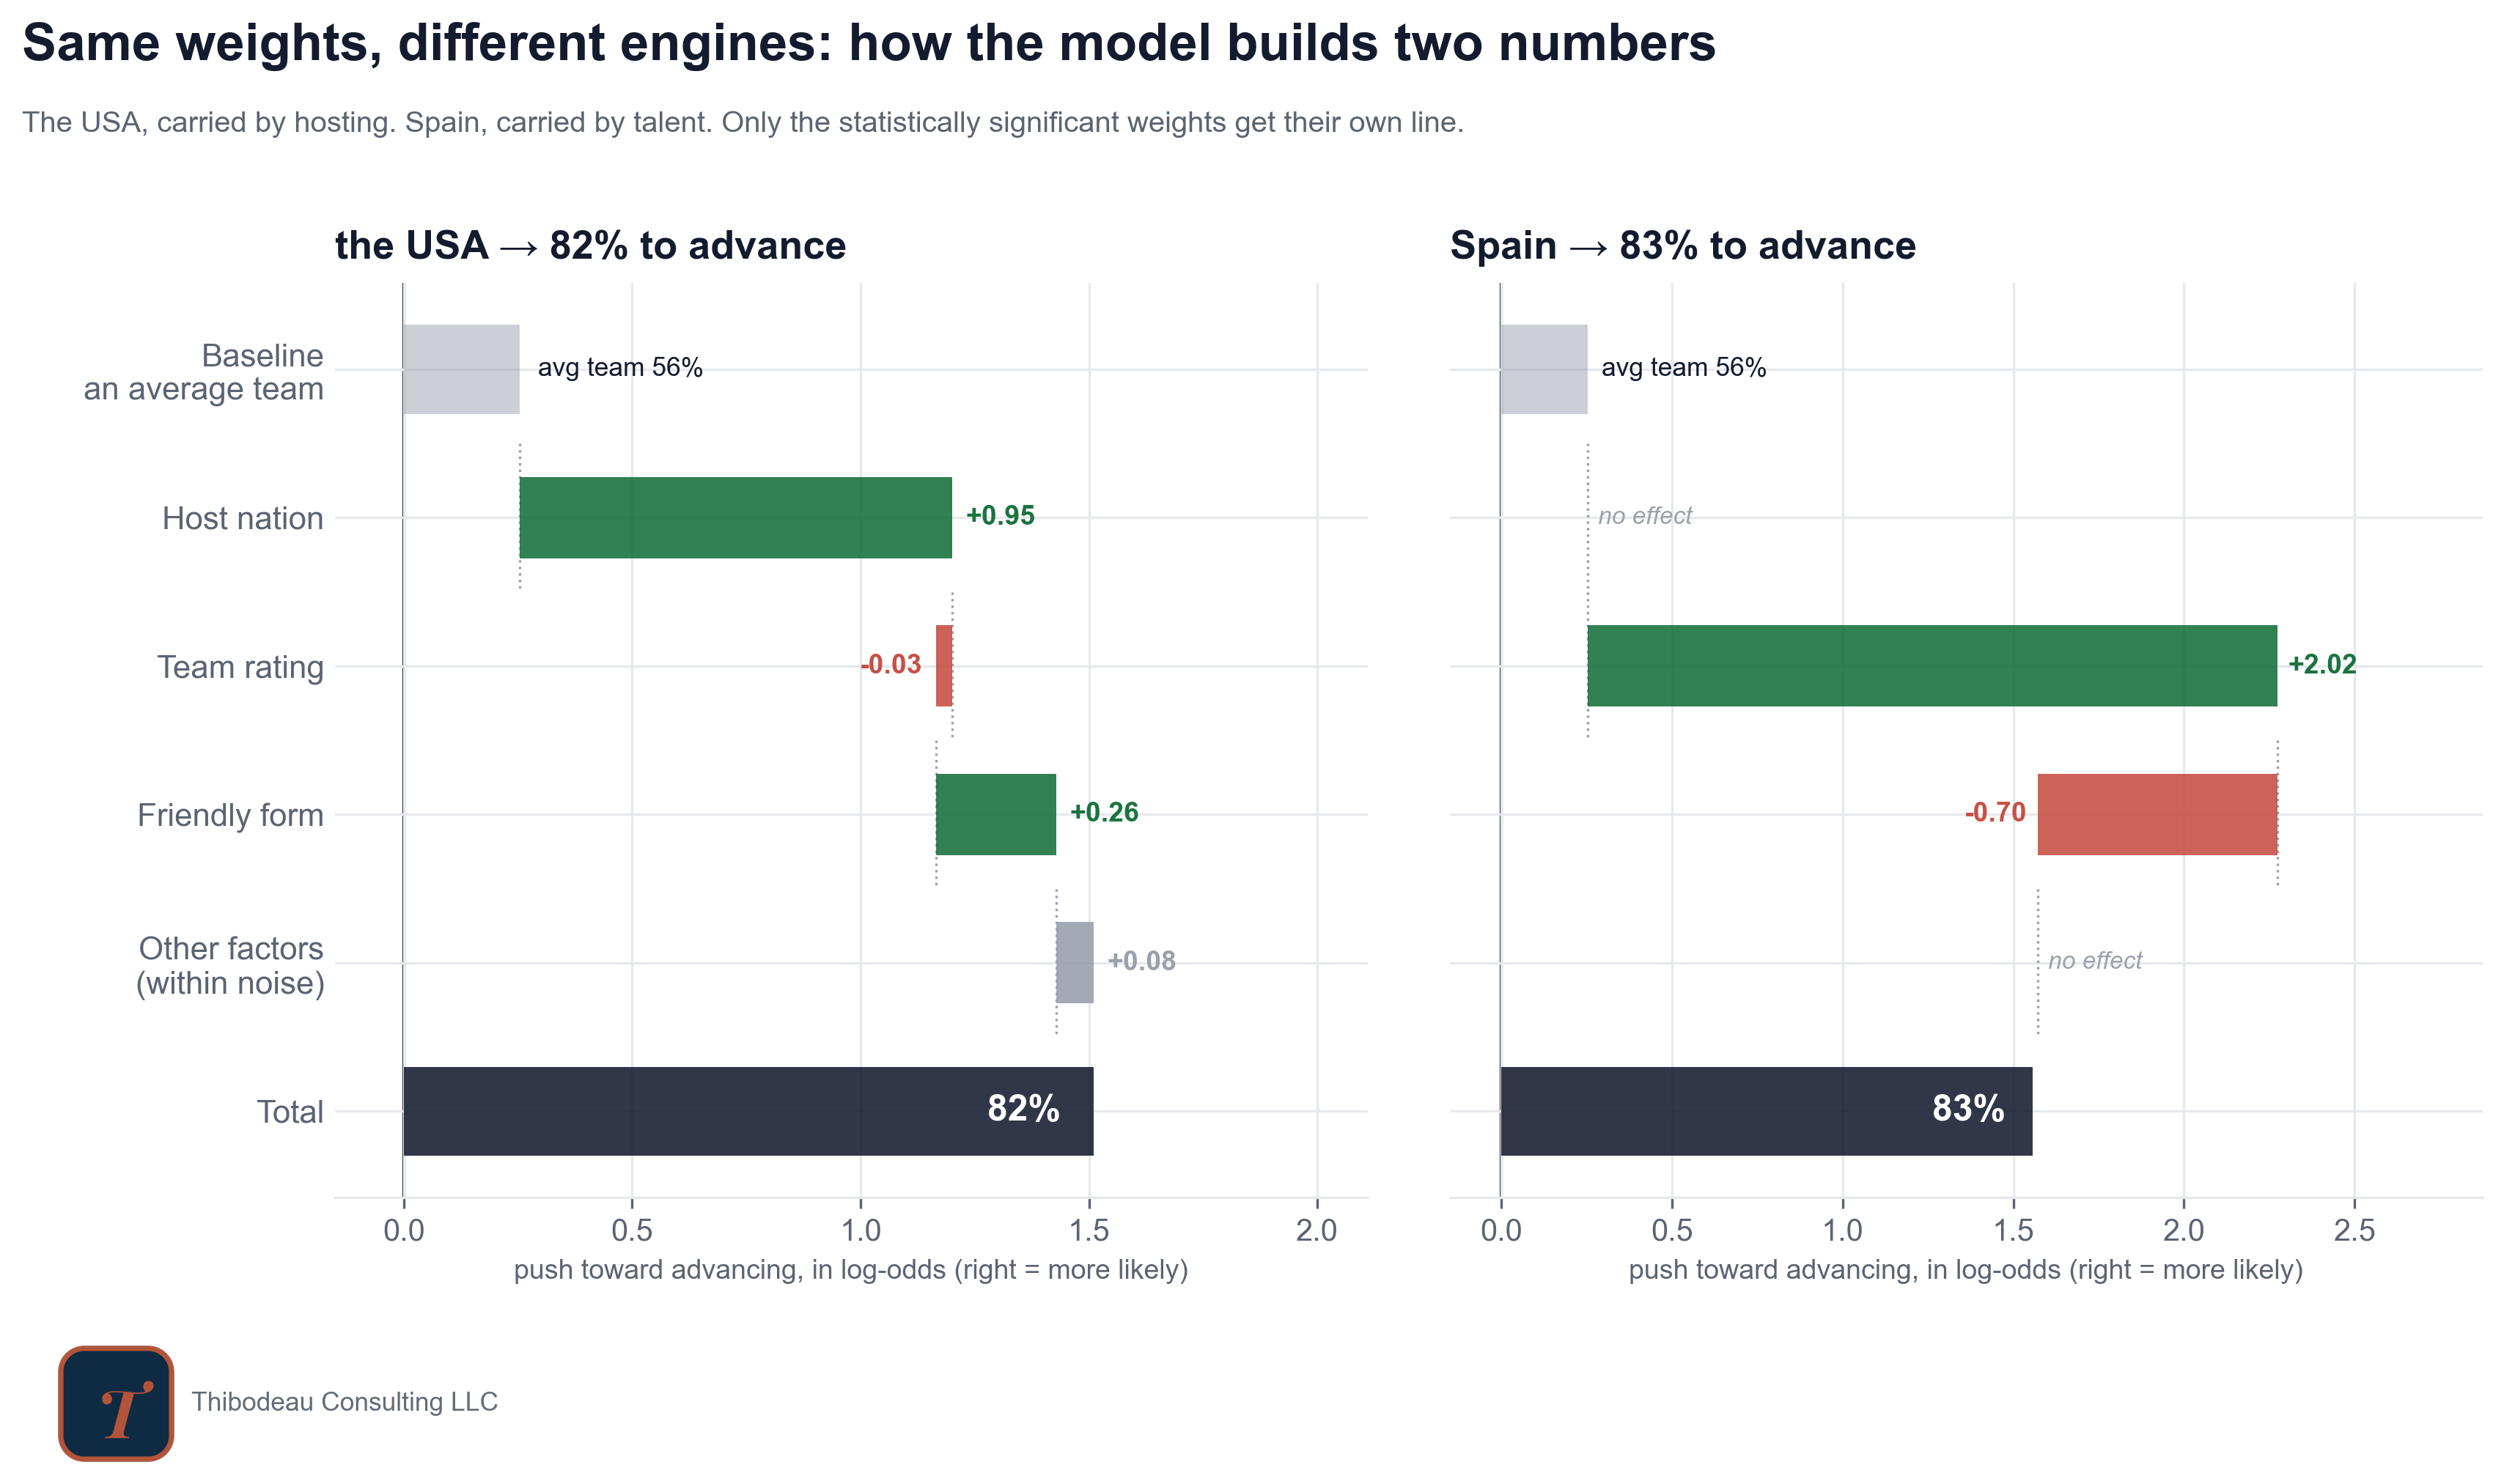
Spain gets there differently. The hosting line is blank because Spain is not hosting this year. Instead, the team-rating line explodes because Spain enters as a genuine heavyweight. But Spain also gets pulled down by friendly form. The model sees recent friendlies that were underwhelming relative to Spain’s rating and subtracts from the total. Talent lifts Spain up, recent form drags it back, and the final probability lands almost exactly where the USA lands.
That is the useful thing about opening the model. A leaderboard would put the USA and Spain next to each other and make them look similar. The receipts show they are not similar at all. One forecast is built from structure. The other is built from strength. Same probability, different machine.
A Couple Details
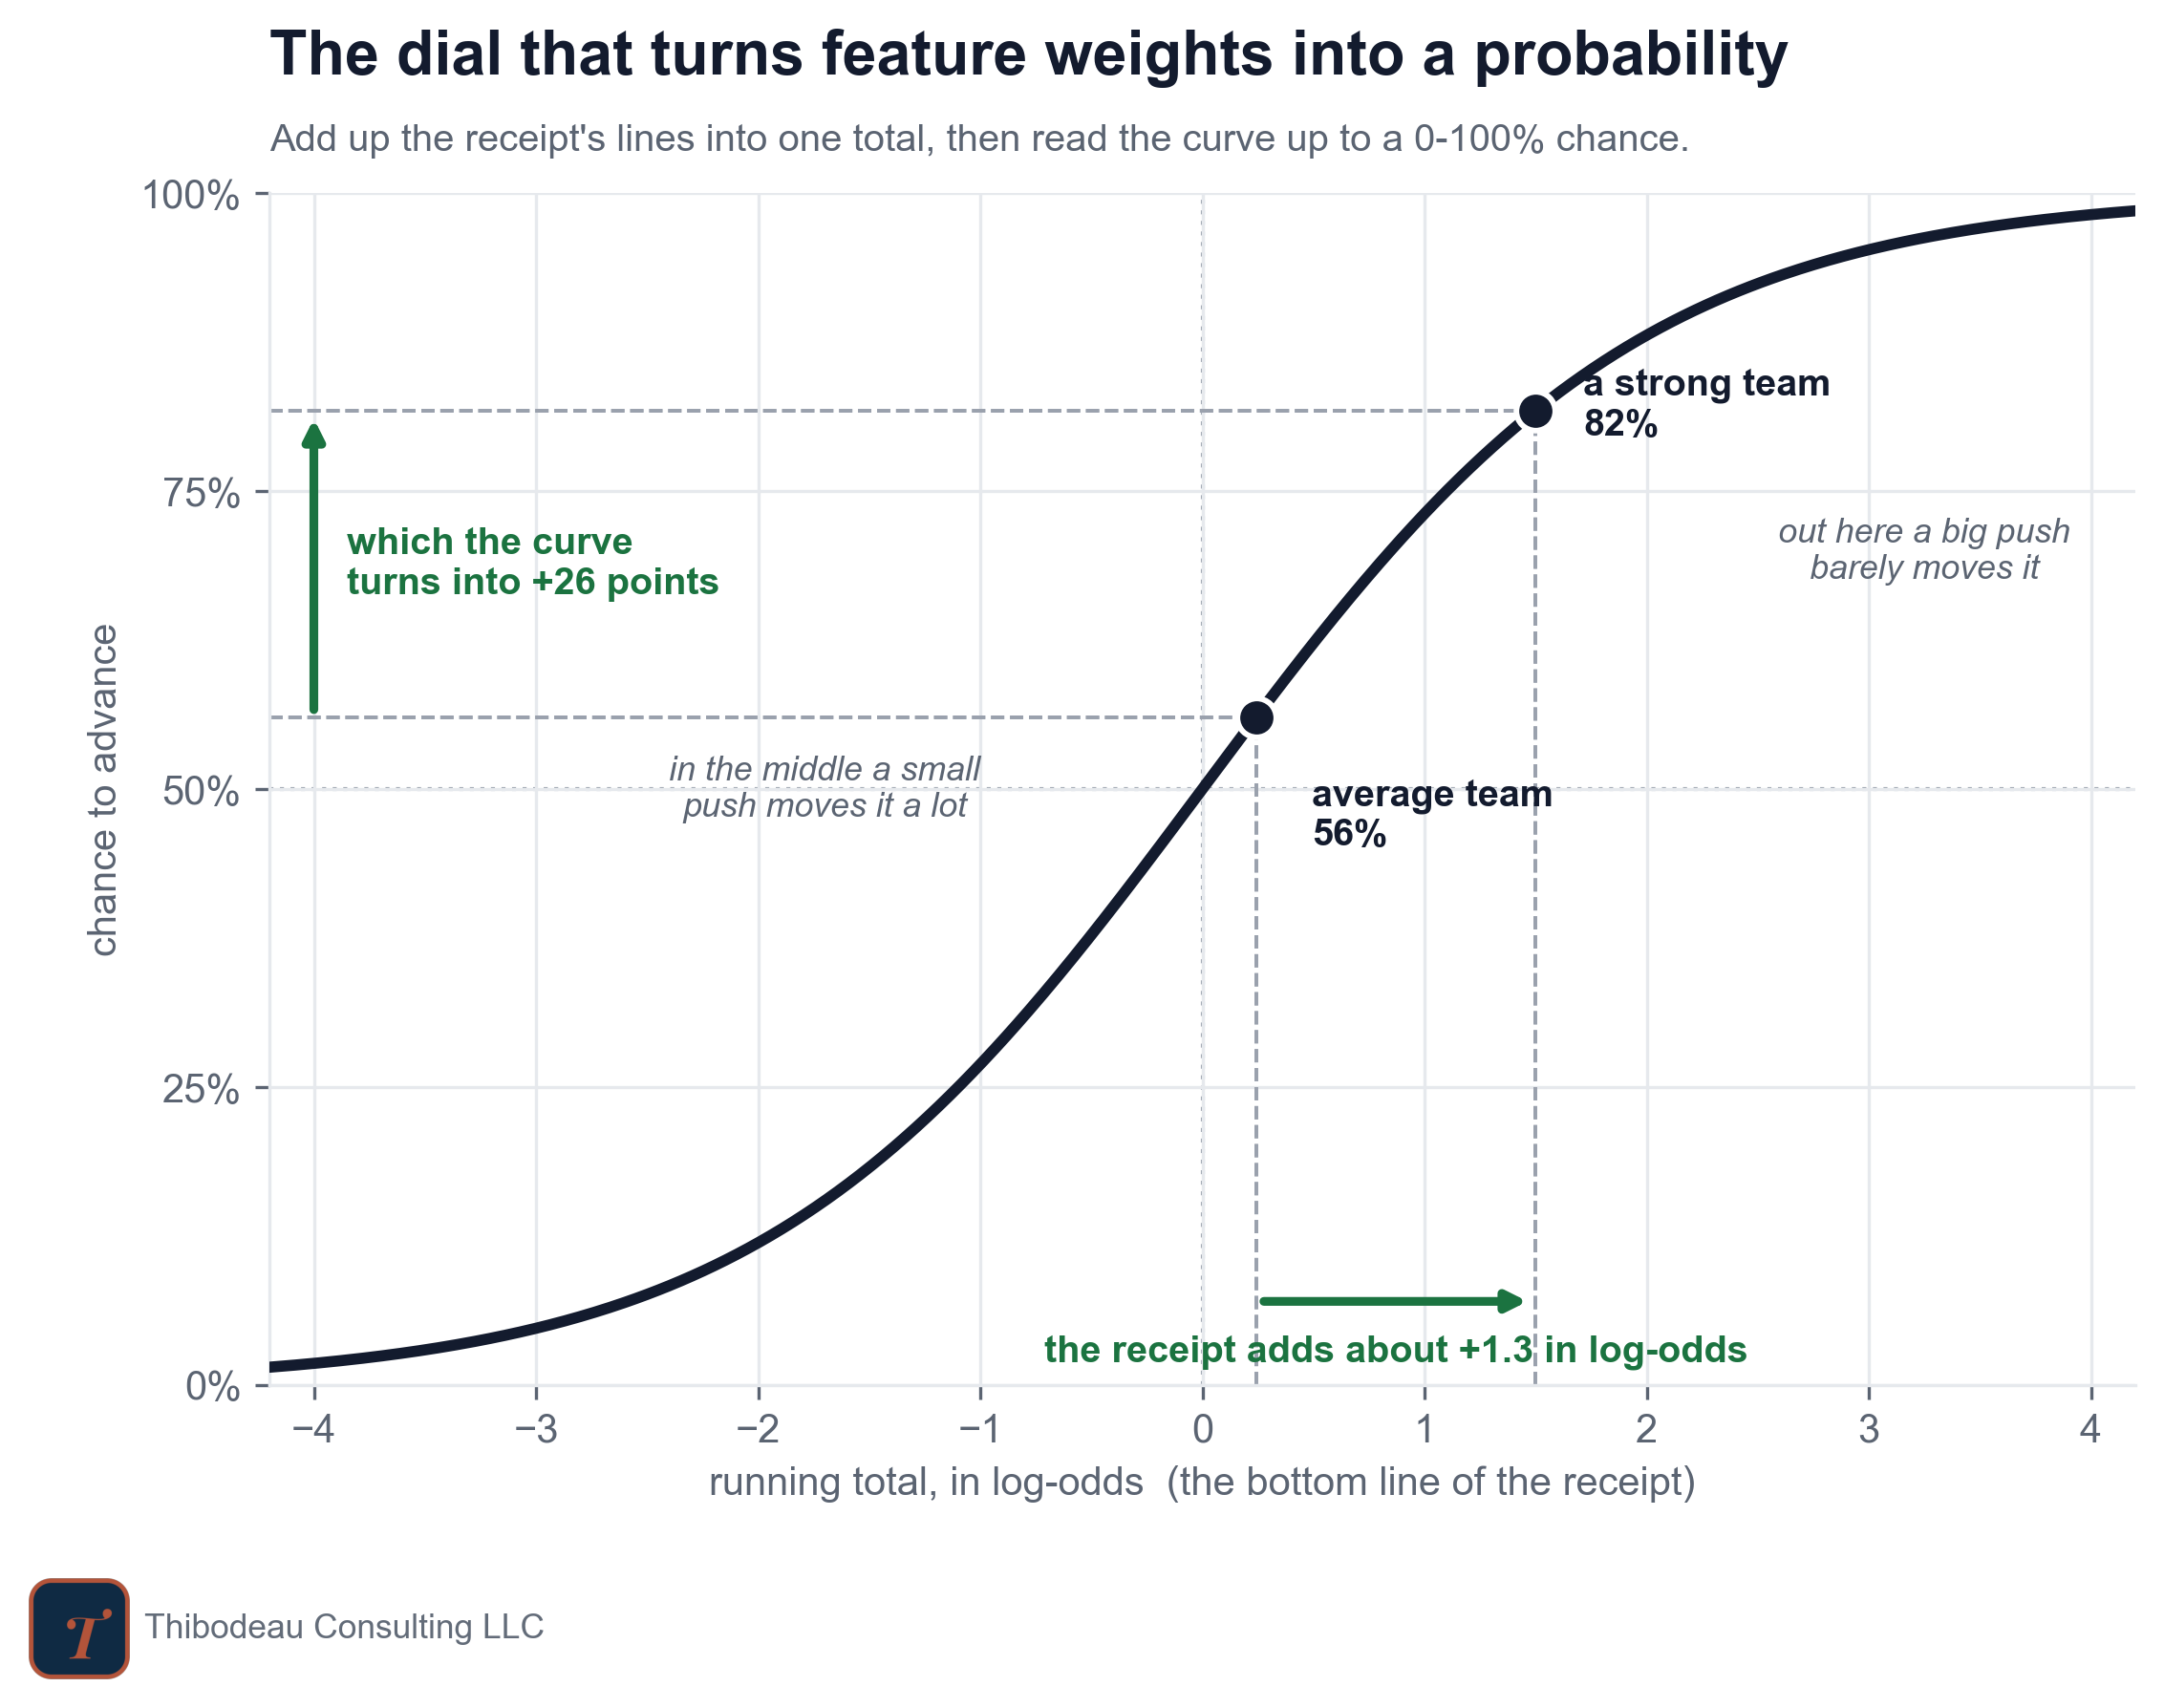
First, the receipt adds feature pushes on a scale called log-odds, not directly on the probability scale. You do not need to think in log-odds, but it is useful to know the reason: probabilities have walls. They cannot go below 0 or above 100 percent, so the same feature push does not always move the final probability by the same amount. Around 50 percent, a small push can move the forecast a lot. Near 95 percent, there is barely any room left. The S-shaped curve below is the dial that turns the receipt’s log-odds total back into a probability.
Second, none of the model’s findings are causal claims. The model is capturing associations, not proving mechanisms. If hosting gets a positive weight, that does not mean we have isolated the causal effect of crowd support, seeding, travel, referees, familiarity, or any other piece of the host experience. It only means host teams have tended to advance more often than otherwise similar non-hosts in this dataset.
That is still useful, as long as we remember what we are doing. These features package soccer, structure, selection, and measurement quirks into numbers that we can play with. The model is not revealing the metaphysical truth of the World Cup. It is asking which pre-tournament facts help separate teams that advance from teams that do not.
Up Next
Tomorrow we switch from building probabilities to grading them. If one model says 60 percent and another says 70 percent, how do we decide which was better after the match is over? That brings us to the Brier score, the scoreboard we have been using all tournament, and the uncomfortable art of judging probabilistic predictions one game at a time.
Todays’s Forecasts
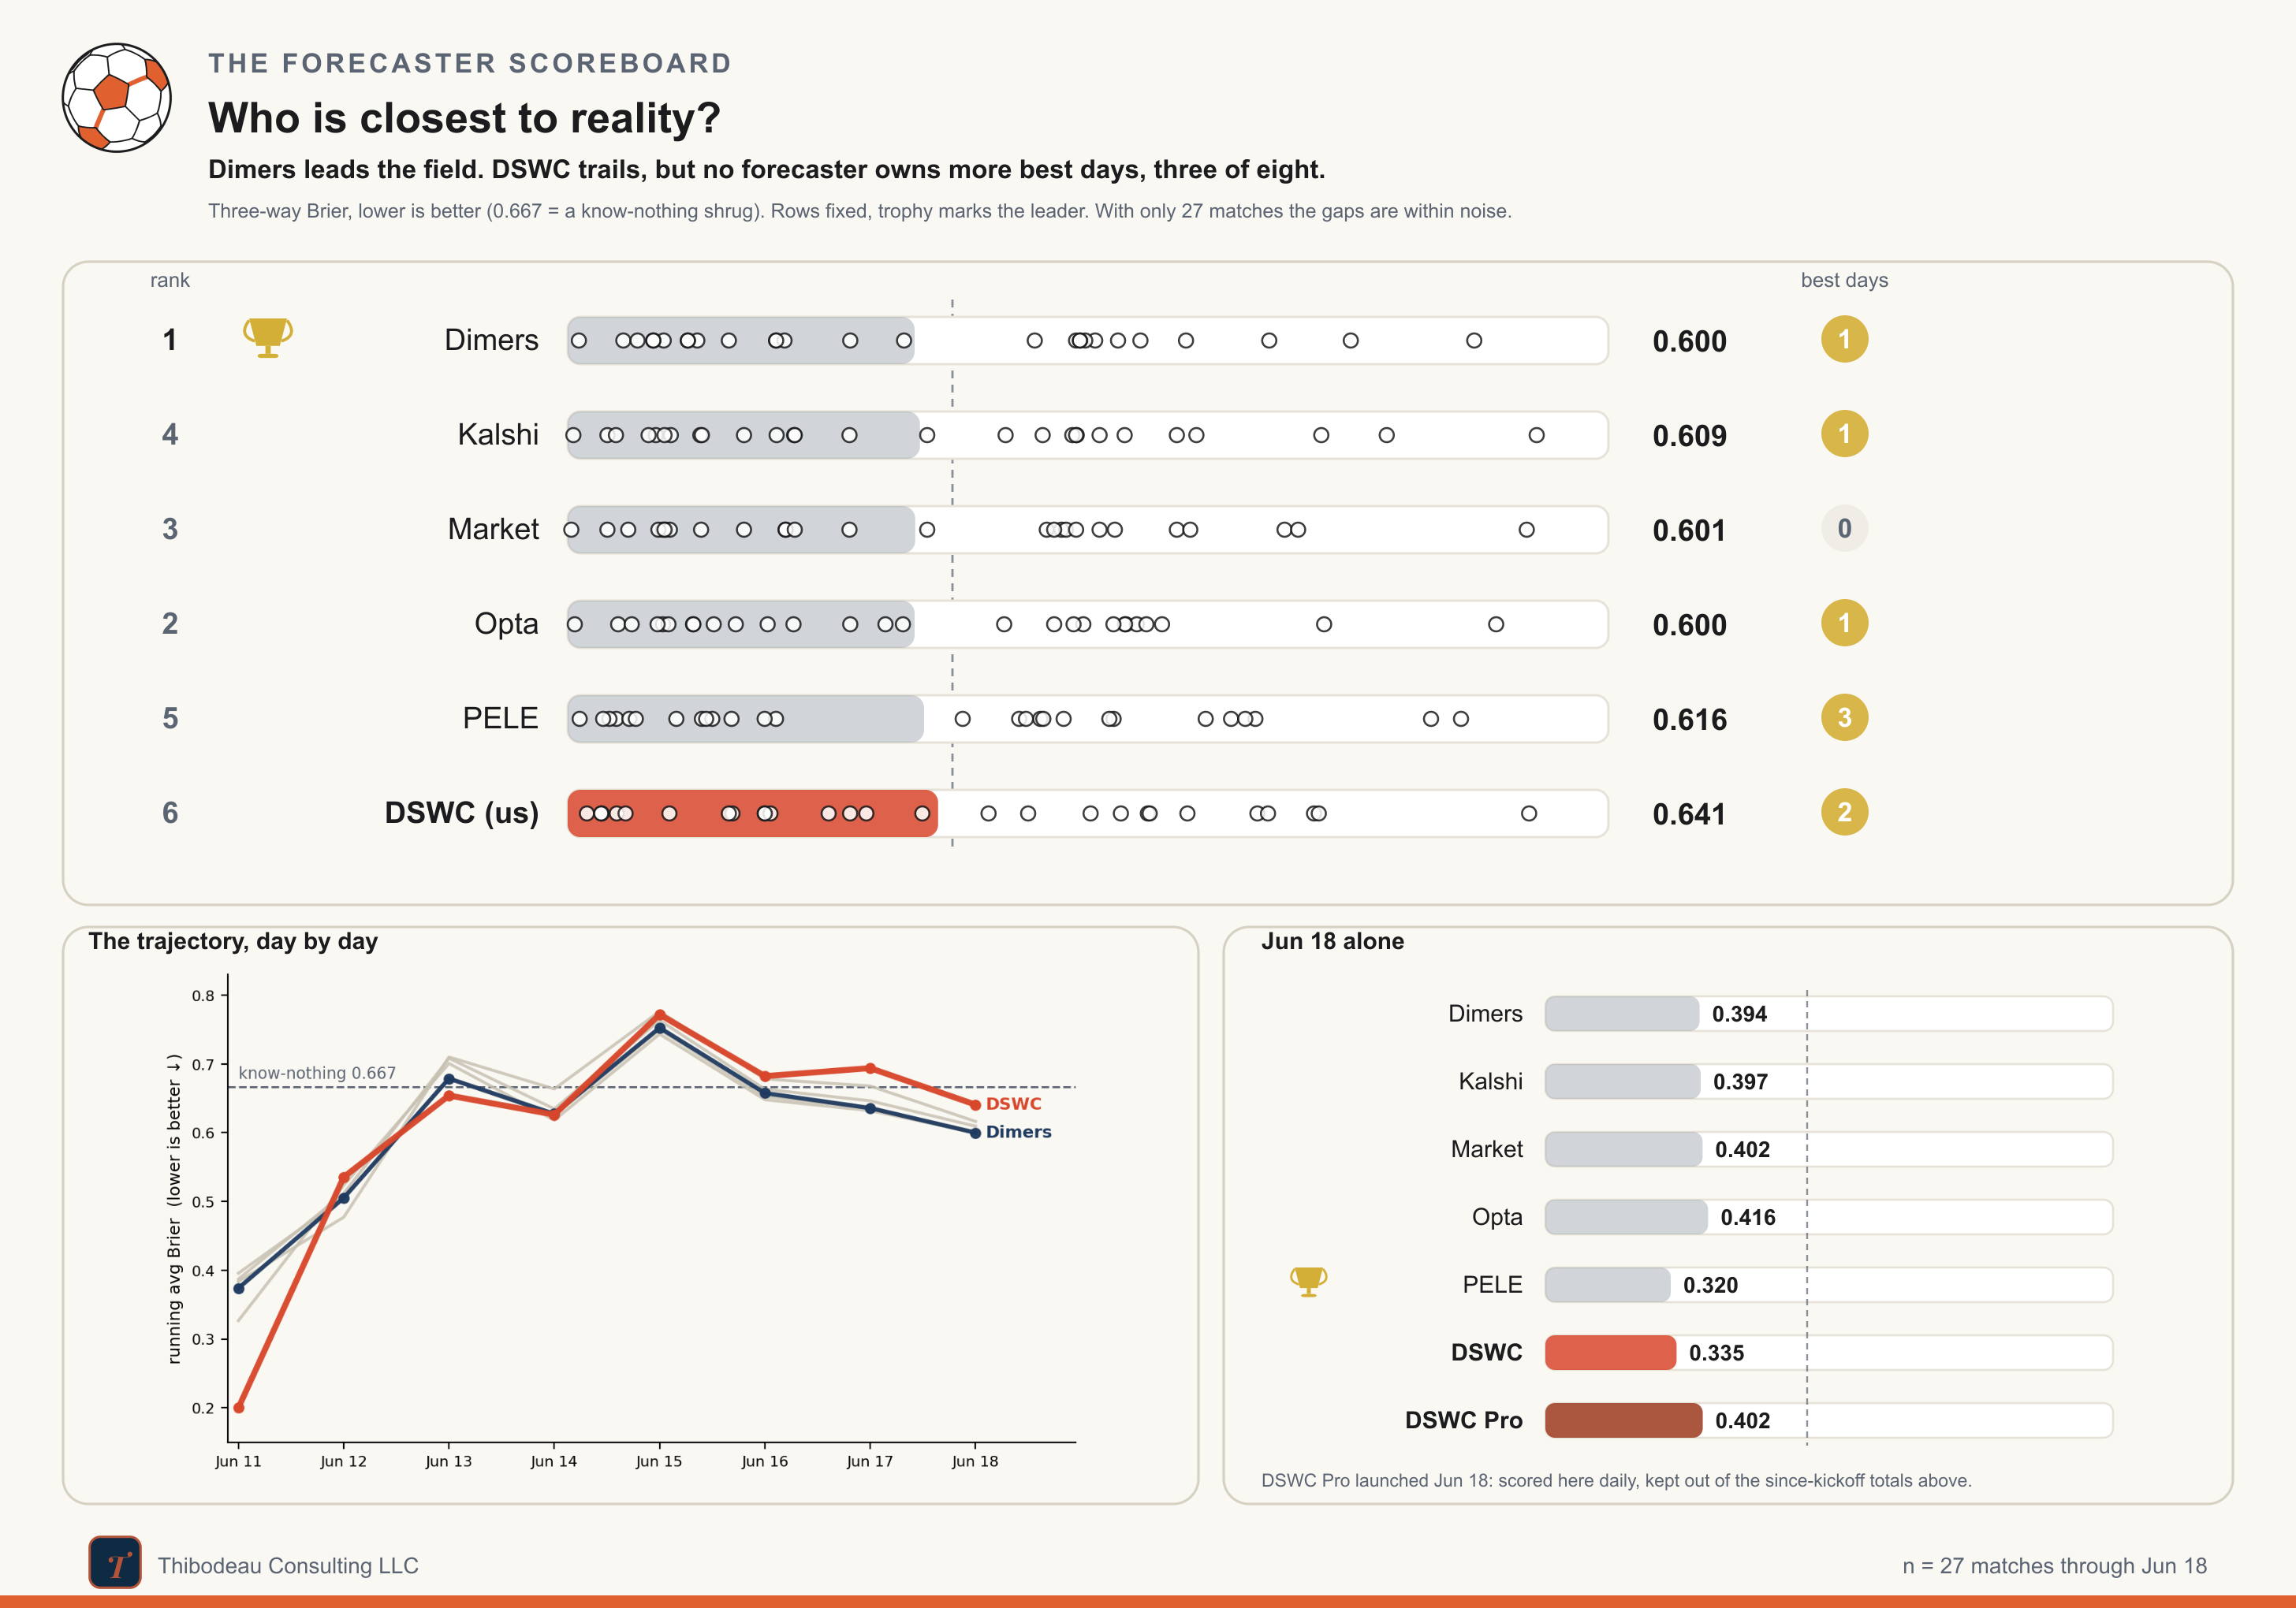
Day eight was kind to the forecasters. Switzerland, Canada, and Mexico all won as favorites, and even the lone miss, Czechia’s draw with South Africa, was not enough to spoil the day. The whole board moved back toward respectability after a rough first week. Dimers and Opta are now essentially tied at the top, both around 0.600, with the market just behind at 0.601. DSWC Classic improved too, but remains last at 0.641. Lower is better; the know-nothing line is 0.667, so at least everyone is back on the right side of the shrug.
There is one new wrinkle today: DSWC Pro. Classic is the simple, results-only model we have been using as a teaching tool all week. Pro is the version that tries to win. It uses the same spirit, but it is allowed to be more pragmatic, combining the information we have learned from the tournament with stronger external signals. I am keeping it out of the cumulative scoreboard for now because it launched midstream, but we will score it day by day from here. And we’ll check in on cumulative performance periodically.
Today’s slate starts with the big disagreement. The market makes the United States a clear favorite over Australia at 61 percent, with Kalshi even higher at 64. DSWC Classic is the outlier, putting the U.S. at only 41 percent and calling the match closer to a three-way coin flip. Pro sits much closer to the field at 57 percent.
The rest of the slate is cleaner. Everyone likes Morocco over Scotland, though PELE is noticeably cooler on Morocco than the rest. Brazil over Haiti is the day’s consensus hammer, with every forecaster between 81 and 88 percent. Turkey-Paraguay is the true toss-up: the whole board has Turkey close to 50 percent, with a draw around 28 or 29.