The Map Still Knows Something
What confederations reveal that ratings can miss

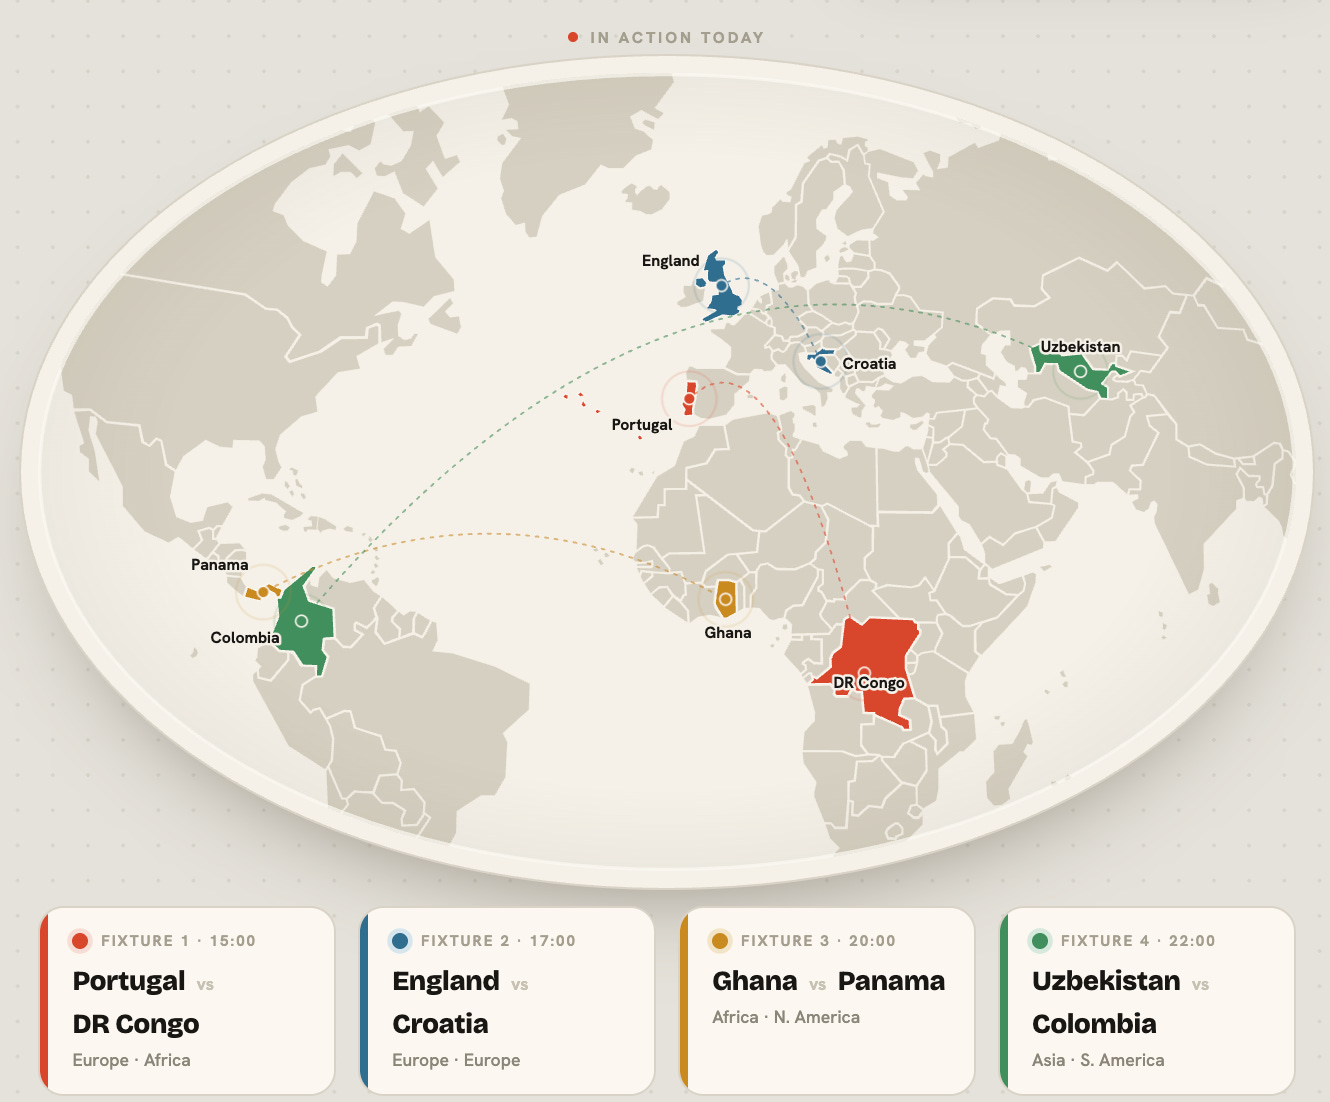
Day seven, and the World Cup turns into a geography lesson. Three of today’s four games send one confederation against another: Portugal against DR Congo, Ghana against Panama, Uzbekistan against Colombia. In the middle sits England-Croatia, an all-European heavyweight test. Today’s post is about what a team’s confederation does, and does not, tell us. But first, a quick recap of yesterday, when the favorites remembered how to win.
Previously, at the World Cup
After a day when every match ended level, day six was the correction. France beat Senegal 3-1, Norway routed Iraq 4-1, Argentina beat Algeria 3-0 behind a Lionel Messi hat trick, and the midnight game went to form too, with Austria seeing off Jordan 3-1. Every favorite delivered.
That made it a good day for forecasters who trusted the chalk and a rough one for ours. DSWC had spent the slate doubting Norway and Austria, rating both closer to coin flips than anyone else did, and both won comfortably. Its one bold call that landed was Argentina. The table at the bottom reordered accordingly.
Question 7: Do Ratings Travel?
International soccer is organized into regional confederations: UEFA in Europe, CONMEBOL in South America, CAF in Africa, AFC in Asia, CONCACAF in North and Central America and the Caribbean, and OFC in Oceania. These are the neighborhoods teams live in most of the time. They determine who you qualify against, who you play most often, how far you travel. Here’s what today looks like from that perspective.
As a feature in a model, confederation is a little strange because it measures the ecosystem around a team, not the team itself. Spain is not good because it is in UEFA. Brazil is not good because it is in CONMEBOL. A confederation does not pass, press, finish, or defend set pieces.
So why include it?
Because a global rating system has to act as if geography does not matter. It assigns one number to every team and treats those numbers as if they live on the same scale. An 1800-rated team from Europe is supposed to mean the same thing as an 1800-rated team from Africa, Asia, South America, or North America. Confederation lets us check whether that assumption holds.
The plot below puts those pieces side by side. On the left is the typical pre-tournament team quality for each confederation. In the middle is how often teams from that confederation advanced from the group. On the right, the two are plotted against each other.
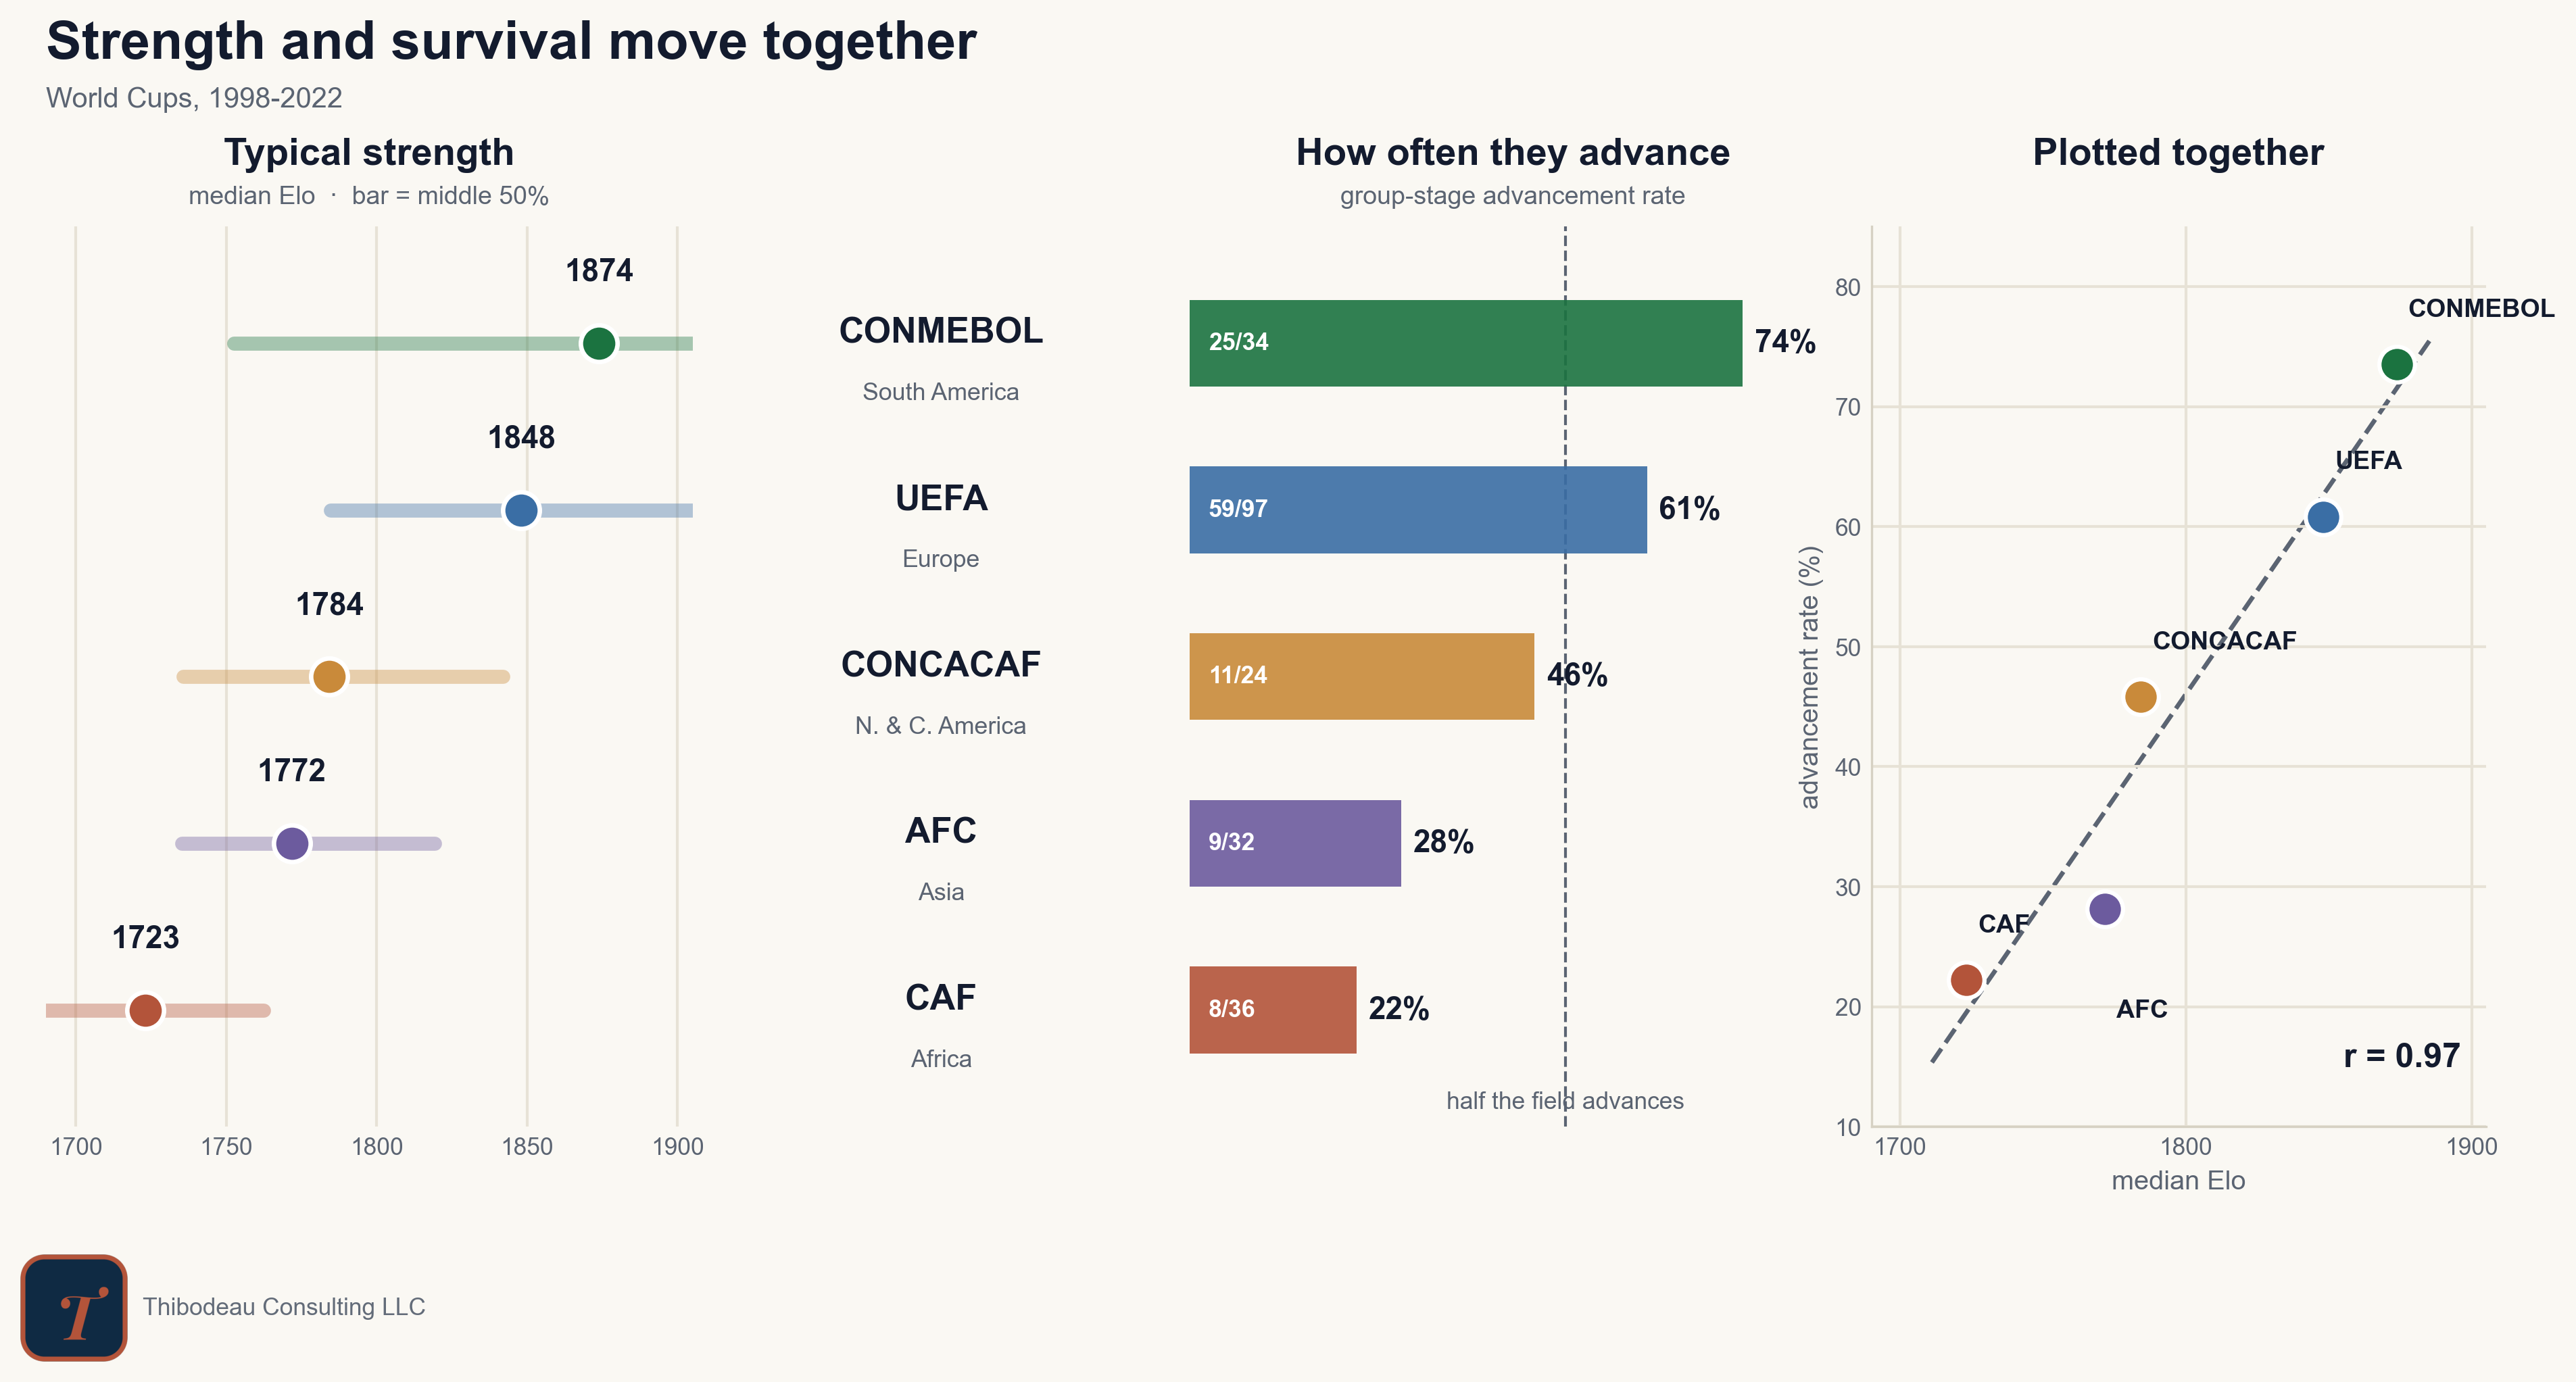
Start with the middle panel, the raw advancement numbers. From 1998 through 2022, CONMEBOL teams advanced from the group 25 times in 34 tries, a 74 percent survival rate. UEFA teams advanced 59 of 97 times, or 61 percent. Then the drop is steep: CONCACAF at 46 percent, AFC at 28 percent, and CAF at 22 percent.
But team quality also differs by region. As the left panel shows, UEFA and CONMEBOL tend to send stronger teams than CAF and AFC, and stronger teams advance more often. So the question is whether confederation tells us anything new. That is, once we know how strong the teams were, does region still matter?
That’s where residuals help. A residual is what is left over after using one variable to explain another. Here, we use Elo to estimate how often each team should have advanced, then ask which confederations did better or worse than that expectation.
The next figure shows the adjustment. The left panel repeats the raw advancement rates. The right panel subtracts what Elo expected from what actually happened. If a confederation sits at zero, its teams advanced about as often as their ratings predicted. If it sits above zero, they overperformed. If it sits below zero, they underperformed.
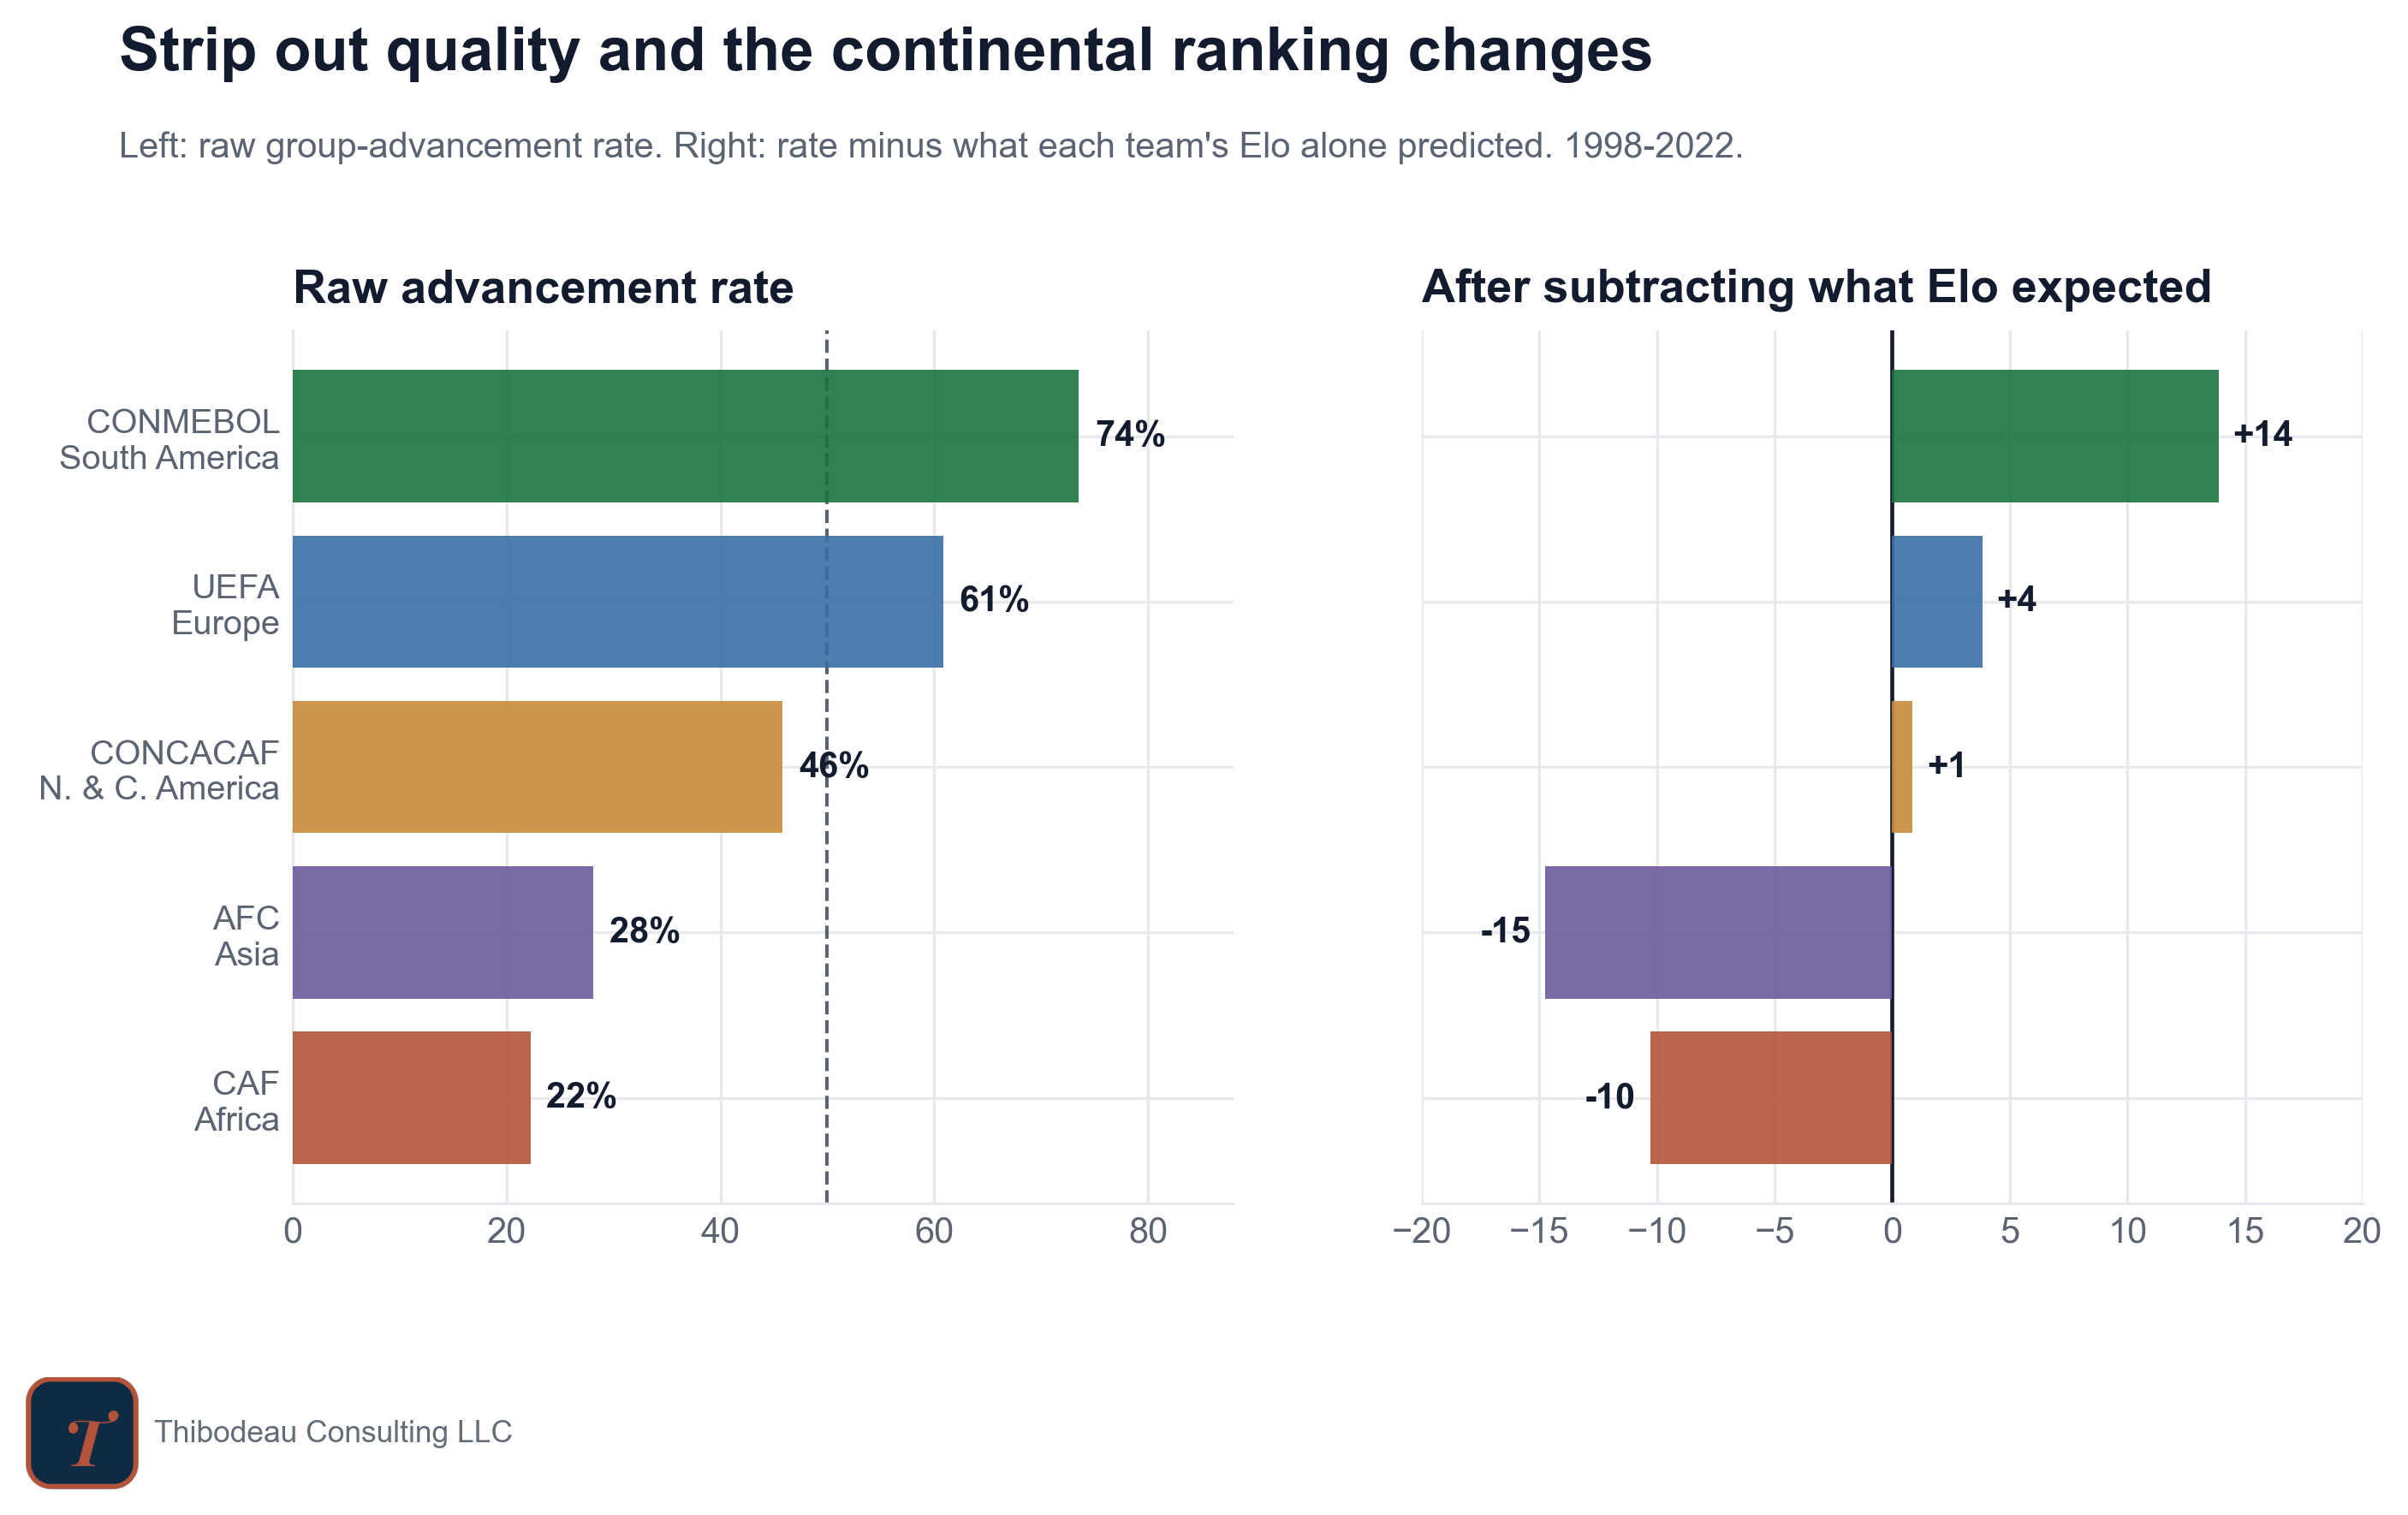
The ranking changes. CONMEBOL is still on top, but now the claim is narrower and more interesting: South American teams advanced about 14 percentage points more often than their ratings alone expected. UEFA is slightly positive, CONCACAF is basically even, and CAF and AFC move negative. The raw chart said, “CONMEBOL and UEFA dominate.” The adjusted chart says something subtler: in this World Cup sample, CONMEBOL ratings have traveled especially well, while AFC and CAF teams have had a harder time turning ratings into group-stage survival.
That does not mean the rating is wrong in some simple way. It could mean several things. Maybe CONMEBOL teams are genuinely hardened by a brutal qualifying system. Maybe their ratings are a little conservative because there are fewer cross-confederation games. Maybe their style travels well in tournaments. Or maybe the sample is still small enough that a few deep runs, rough draws, and weird groups are doing too much work.
That uncertainty is the point. Confederation is not a clean answer. It is a clue that the global scale may need to be calibrated in tournaments where confederations collide.
So what does confederation know? Mostly, it knows team quality. Regions that send stronger teams advance more often. But after quality is stripped out, the map does not go completely silent. CONMEBOL still looks a little better than expected, AFC and CAF a little worse.
That gives us today’s concept: transportability. A measurement travels well if the same number means the same thing in a new setting. An 1800-rated team should be an 1800-rated team anywhere. Confederation is one way to ask whether that is true.
That is why today’s games are not just games. Portugal-DR Congo, Ghana-Panama, and Uzbekistan-Colombia are calibration checks. If the ratings travel cleanly, confederation should not matter much once quality is known. If they do not, the map still knows something.
We’ll get the clearest view when we put all the predictors into the model together, which we’ll do in a couple of days. Tomorrow, we’ll cover our last context feature: hosting as teams embark on their second game of the group stage. Then we’ll turn to the full model.
Today’s Forecasts
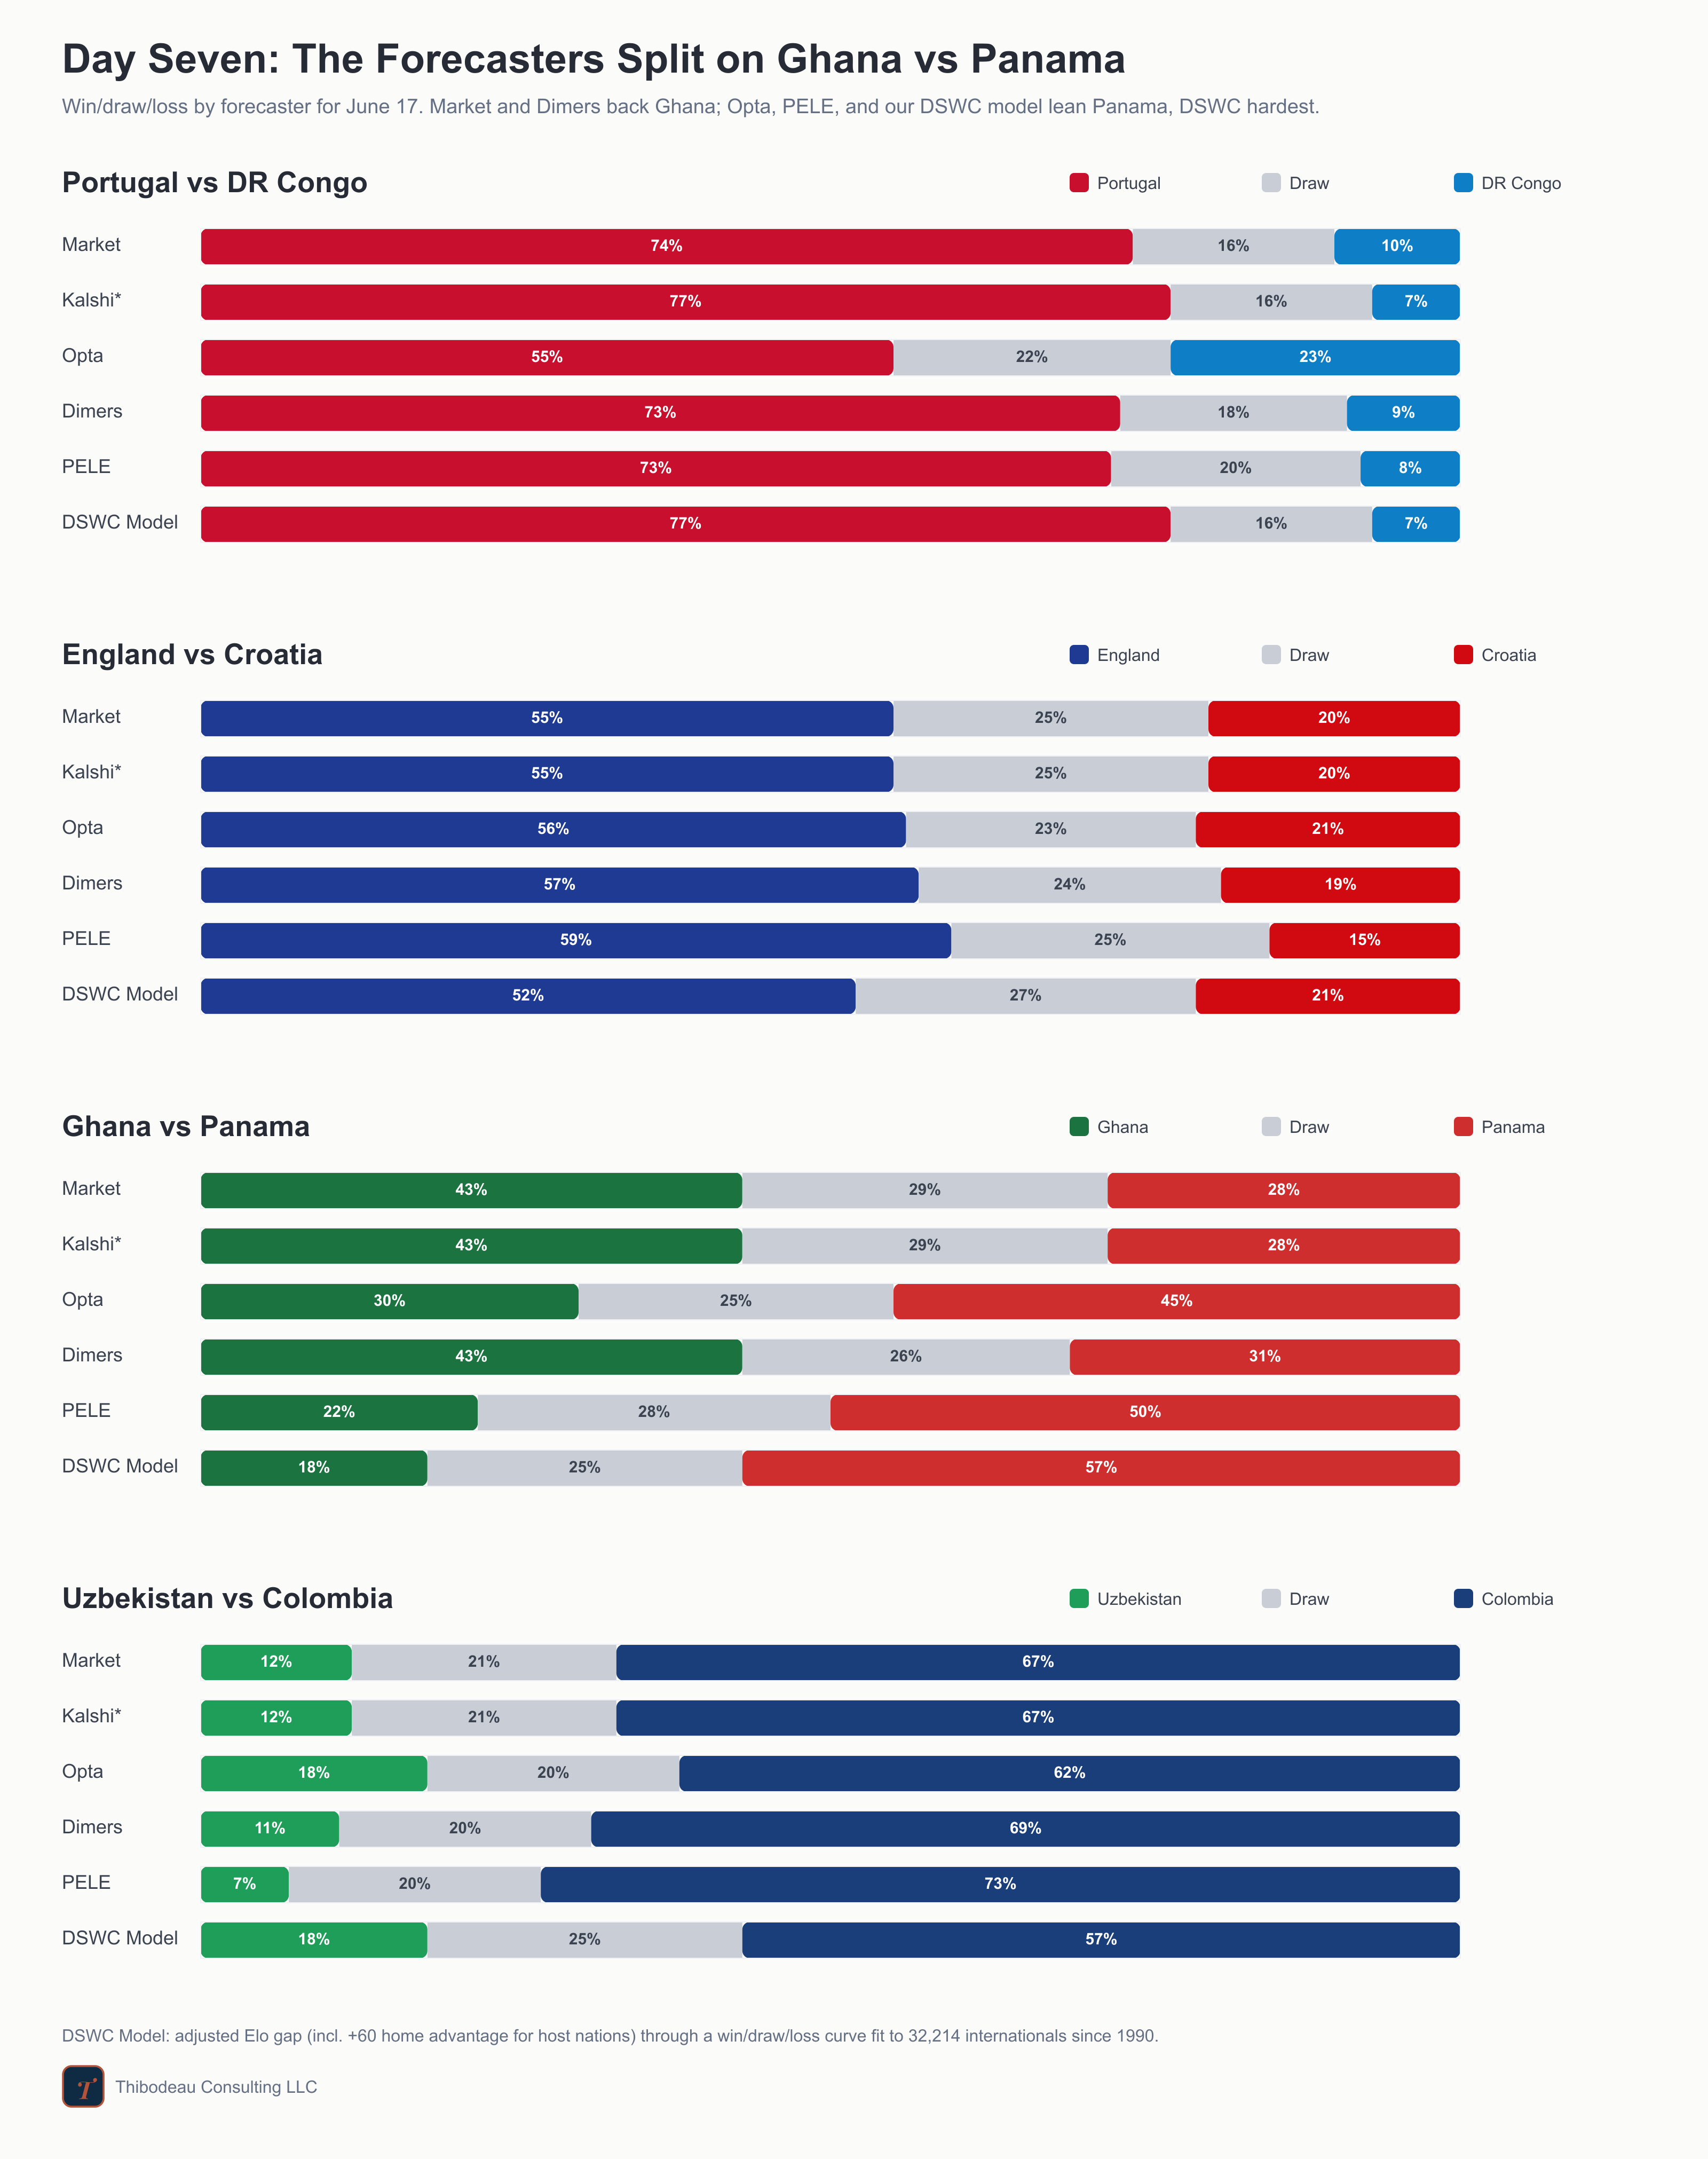
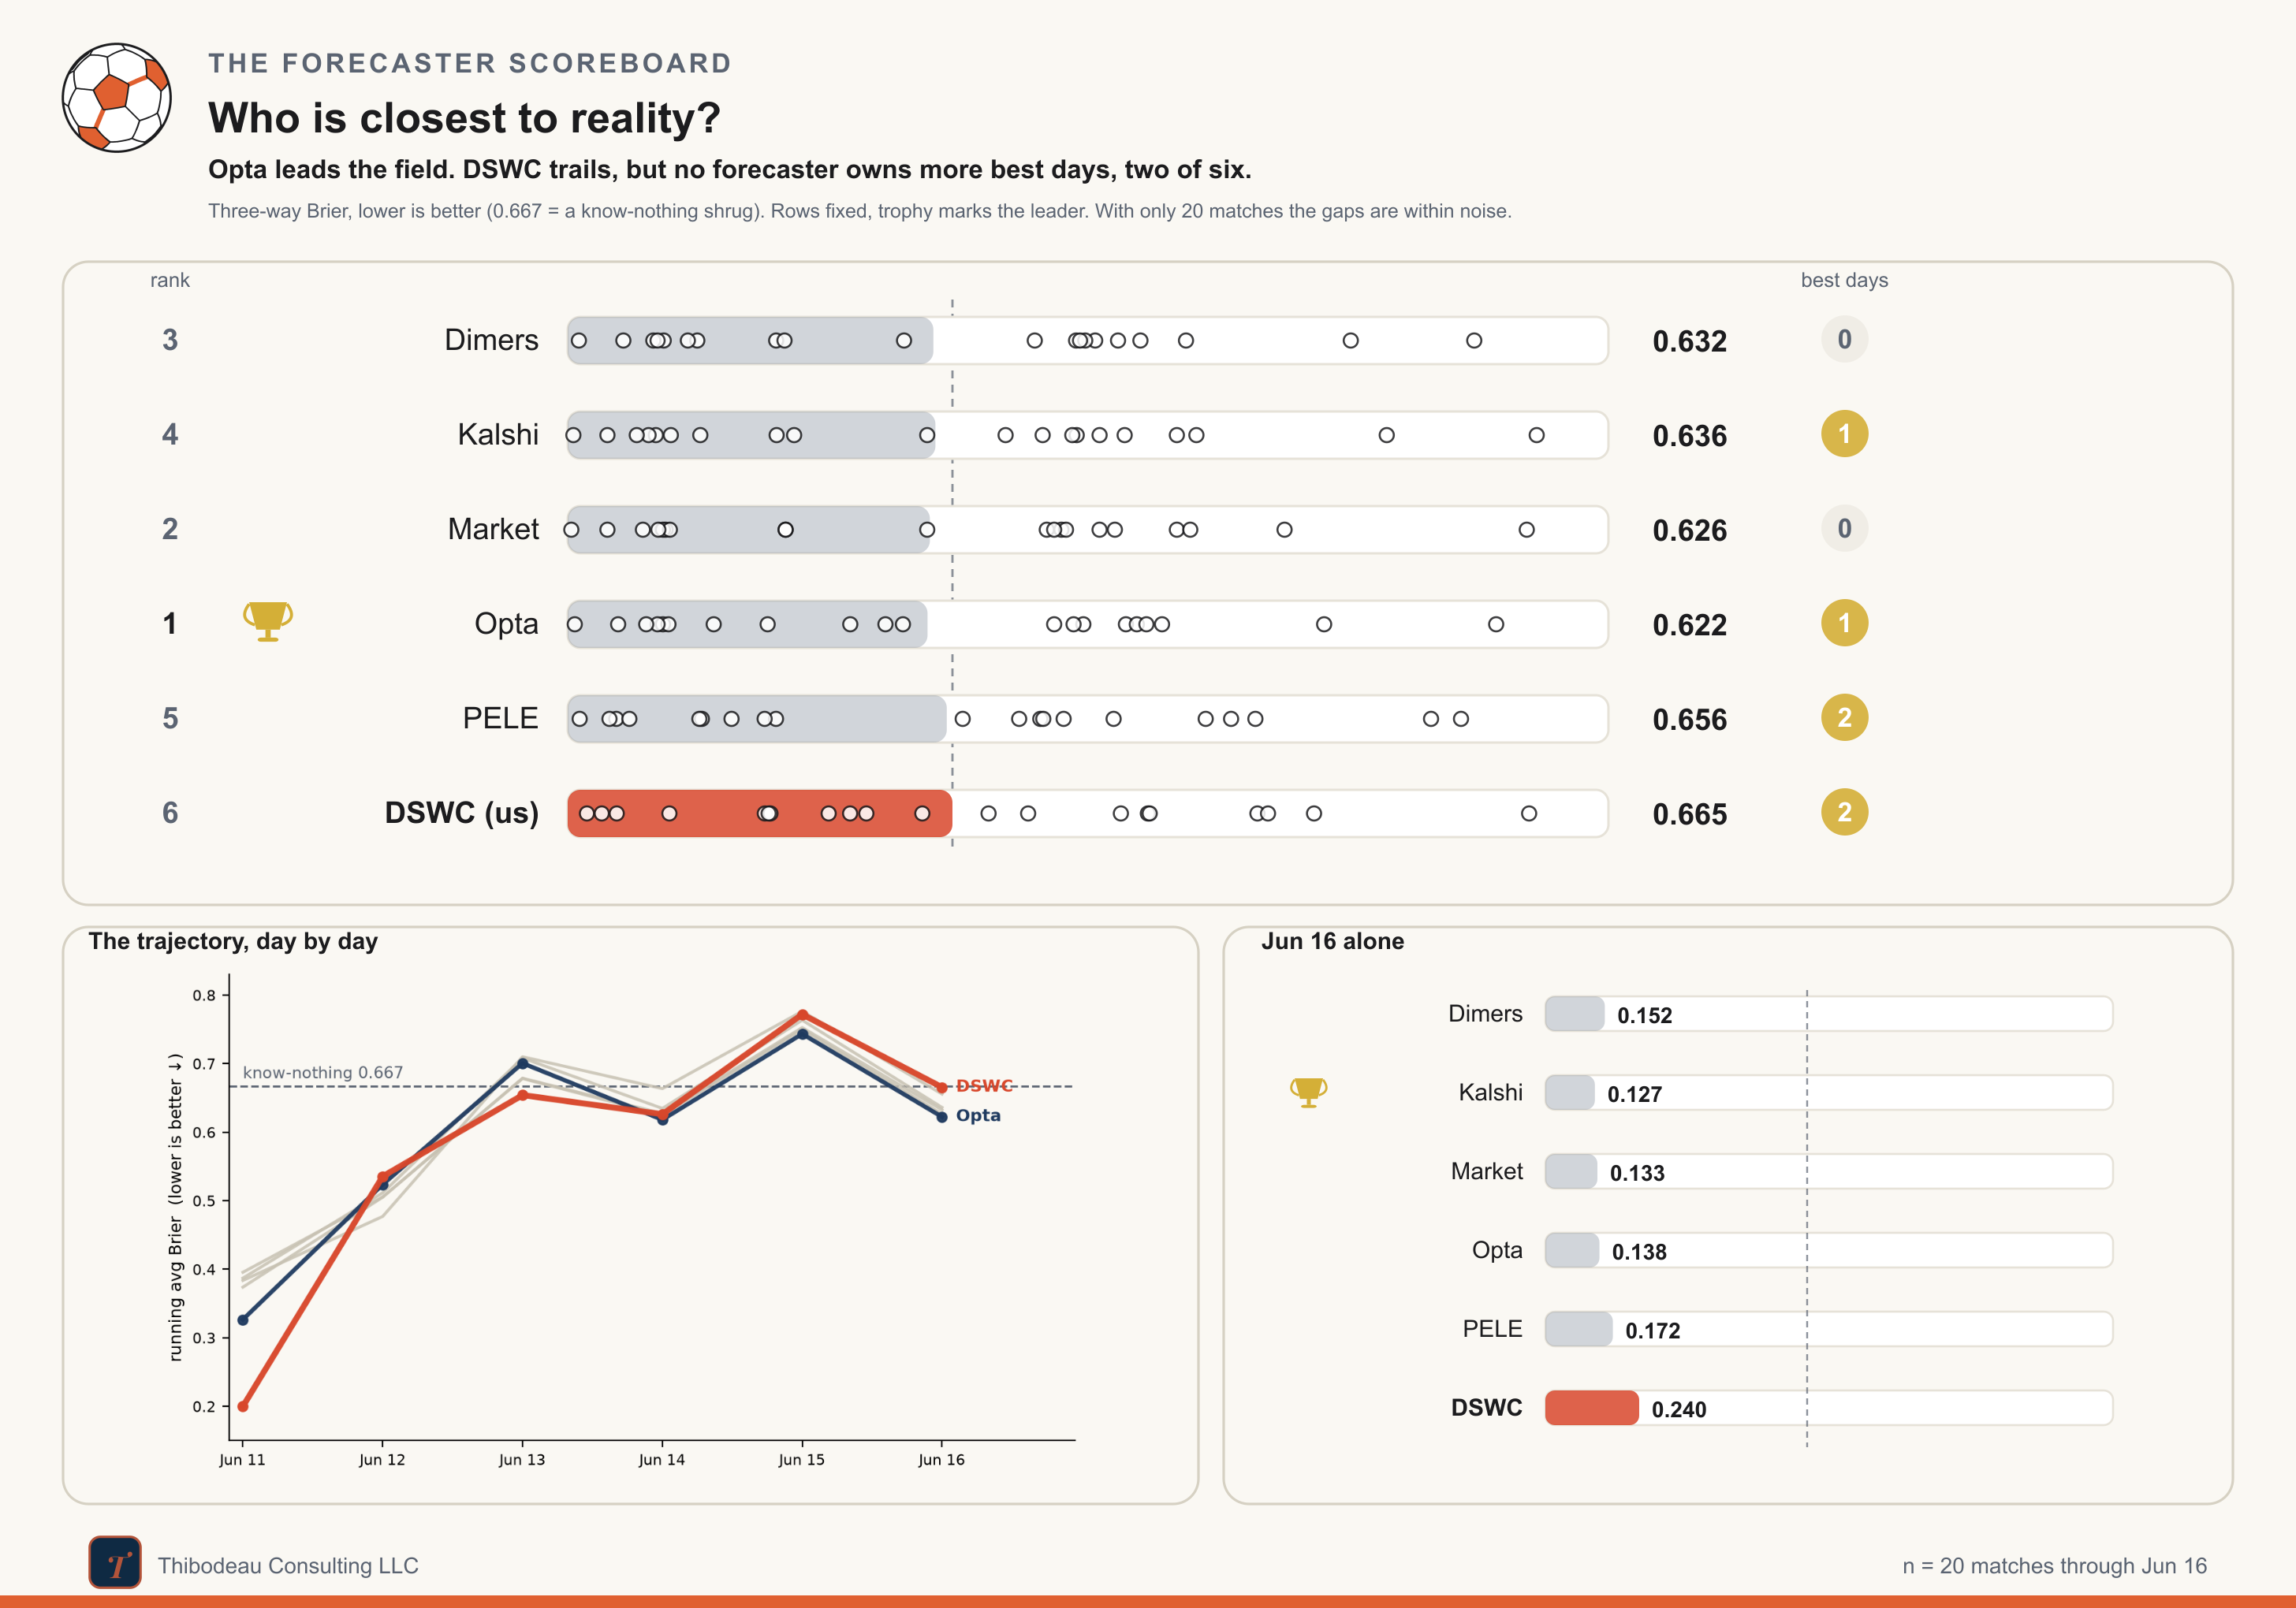
The scorecard has a new look today, so let me decode it quickly. We’re still using three-way Brier score: lower is better, and a “know-nothing” forecast that gives every match a 33/33/33 split scores 0.667 on average. The main panel shows each forecaster’s average score through 20 matches. The dots are individual games, so you can see not just who is ahead, but how each model got there: steady small misses, occasional disasters, or a mix of both.
Through twenty matches the scoreboard now reads Opta 0.622 in front, then the market 0.626, Dimers 0.632, Kalshi 0.636, PELE 0.656, and our DSWC model 0.665 in last. But the gaps are tiny, and with only 20 matches, they are mostly noise. The “best days” column is a reminder of that volatility: PELE and DSWC have each won two daily slates, even though both sit near the bottom overall. Being best on a day and best over the tournament are not the same thing.
The bottom-left panel shows the day-by-day trajectory. Day five’s four draws pushed everyone above the random line; day six’s favorite wins pulled most forecasters back down. Remember that lower is better.
The bottom-right panel isolates yesterday. Kalshi had the best day, the market and Opta were right behind, and DSWC trailed because it was too skeptical of Norway and Austria.
Today’s slate includes four games. The one this post cares about most is Ghana against Panama. It is CAF versus CONCACAF and the forecasters split right along that seam: the market and Dimers lean Ghana, while Opta, PELE, and our model all lean Panama, DSWC hardest of all. The rest are chalk with footnotes. Everyone backs Portugal over DR Congo, though Opta is oddly cautious there; Colombia is favored over Uzbekistan, with our model the most doubtful of that favorite; and England-Croatia is the day’s coin flip, where we have England barely ahead. If our confederation read is correct, Ghana-Panama is where it shows tonight.