
The Group Stage Was Less Weird Than It Looked
It may have felt more chaotic, but the table tells a simple story of things played out

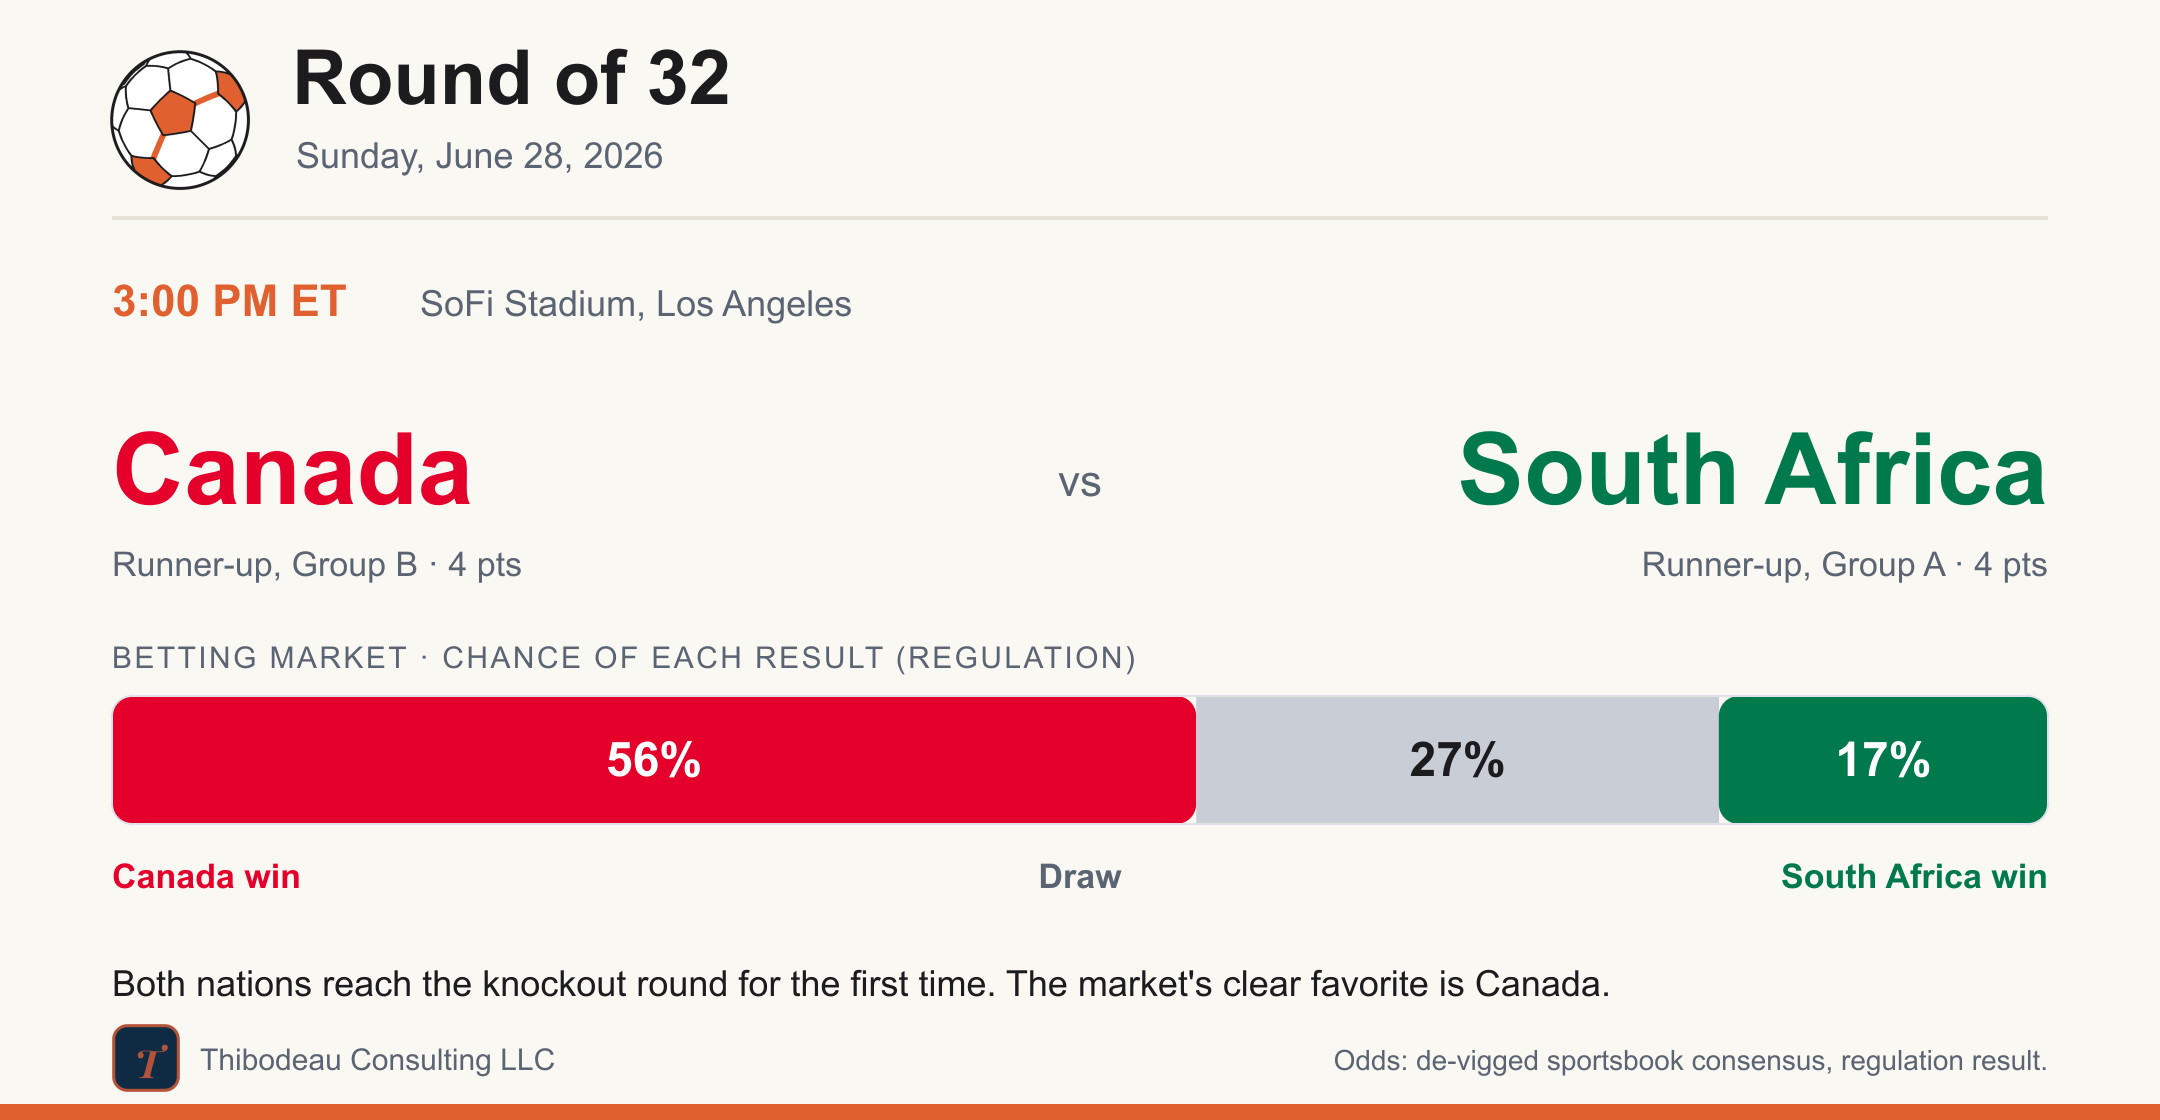
Day 18, and the bracket is finally real. The waiting rooms are closed, the third-place math is over, and the knockout round starts today with Canada against South Africa.
Before we get there though, I want to take a look at what the group stage really taught us: what mattered, what fooled us, and which stories still hold up once we put numbers on them. But first, a quick recap.
Previously, at the World Cup
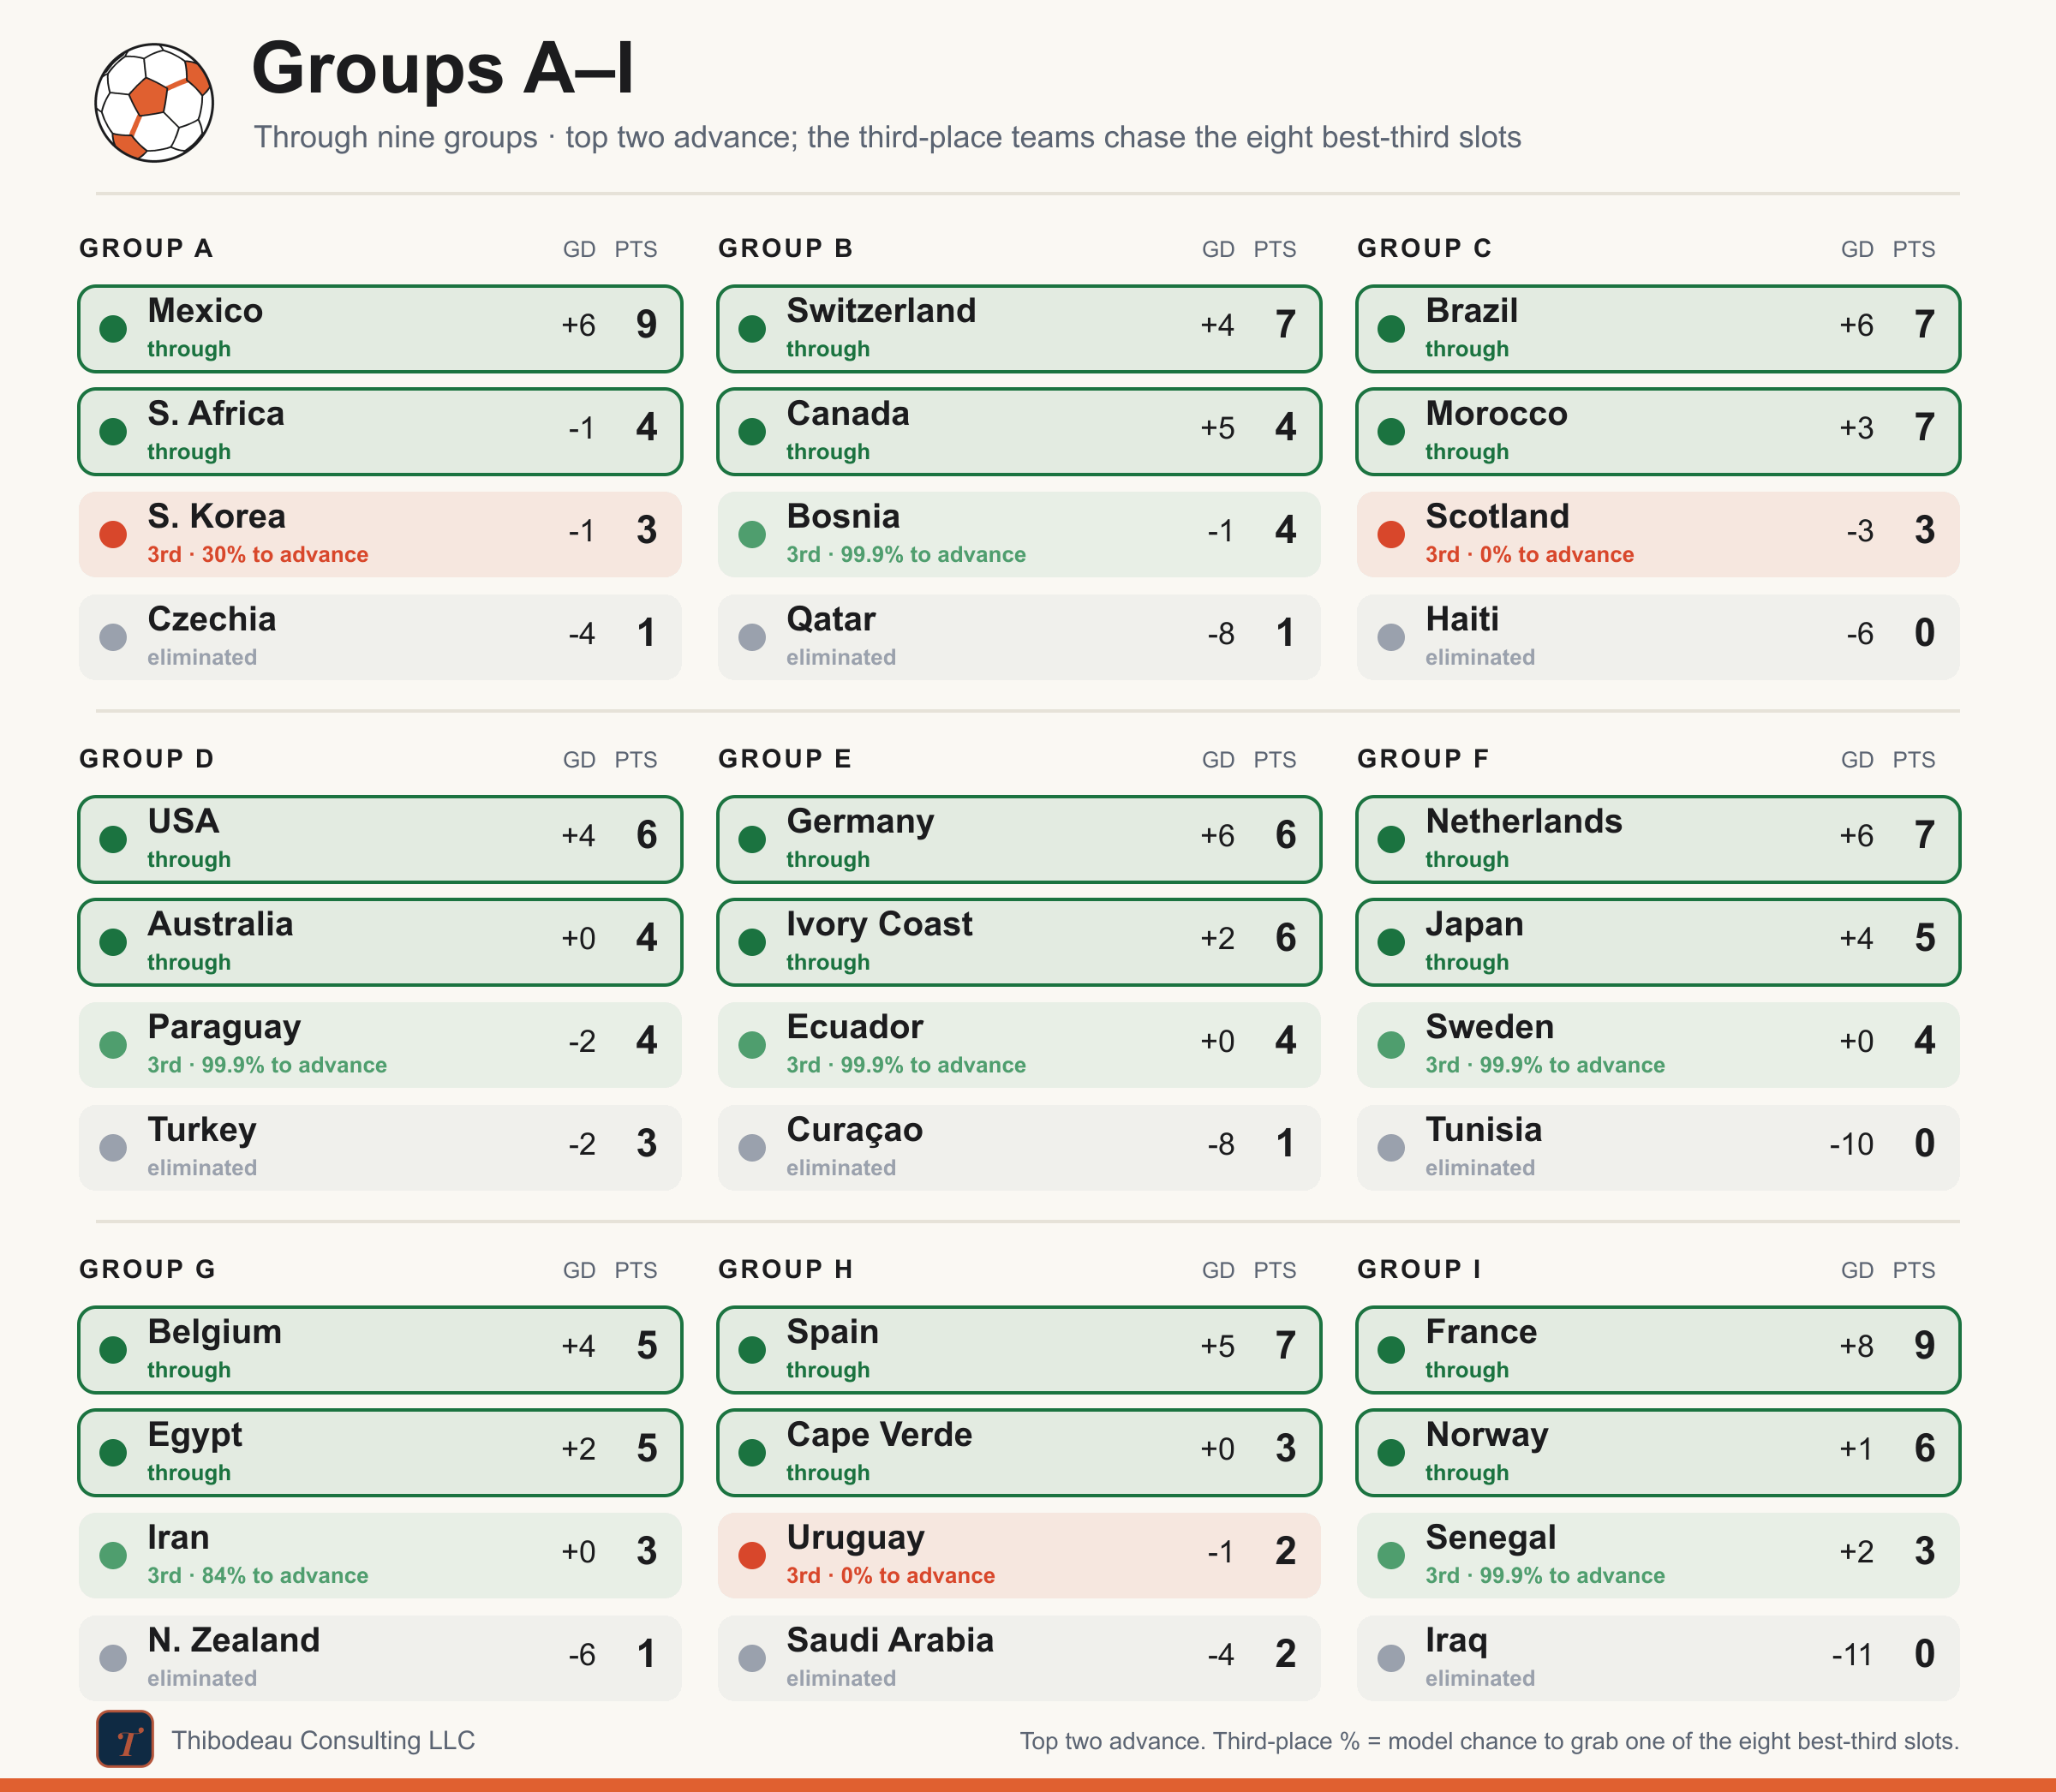
Day seventeen closed the group stage. England beat Panama 2-0 to win Group L, while Croatia beat Ghana 2-1 to take second. Ghana still survived as one of the best third-place teams, which is the whole new format in one sentence.
Group K settled more quietly at the top and more loudly at the bottom. Colombia and Portugal drew 0-0, enough for Colombia to win the group and Portugal to take second. DR Congo did what it had to do, beating Uzbekistan 3-1 to jump into the third-place qualifiers.
The wildest game came in Group J, where Algeria and Austria traded six goals in a 3-3 draw. Austria took second on goal difference; Algeria landed safely in the third-place pile. Argentina finished the job against Jordan, winning 3-1 to close a perfect nine-point group stage.
And with that, the waiting room closed. The last eight third-place teams are in, the other four are out, and the first 48-team World Cup finally has its 32-team bracket. Here’s a look at how the group tables finished up.
Question 18: Which group-stage stories survive the numbers?
The 2026 group stage is over, and the internet has already decided what it was about. It just can’t agree. Some say it’s been an especially chaotic year. Others point to the conditions, the heat and the travel and the brutal schedule grinding teams down. There’s a camp convinced the expanded 48-team field has handed us cagey, low-scoring, draw-heavy football. And there’s another that has decided this is the tournament where the underdogs finally closed the gap on the teams with more expensive talent.
Now that the bracket is set, today is for putting those stories on the table and checking them against the numbers. A few survive. Most do not.
The Toolkit
To test the storylines, we’ll turn them into measurements and compare them with the results. We built or borrowed five. The first three are familiar. The next two are new to this series.
Elo rating — our results-only strength number, built from international matches since 1990, with a host bump.
The market — the de-vigged betting price, which folds in talent, form, injuries, lineups, and whatever else bettors know.
Table state — each team’s incentive in its final game: already through, must-win, draw-is-enough, chasing third, or effectively done.
Squad value — total roster value from Transfermarkt, in millions of euros. It is not perfect, but it is the cleanest blunt proxy for raw talent: how much the global player market thinks each squad is worth. We use it to ask whether richer, deeper teams actually separated from the field.
The stress index — a composite score for each team’s group-stage path. It combines travel distance, heat, altitude, playing surface, and time-zone shifts into one score. It is designed to capture the “this tournament is wearing teams down” theory in a single number we can test against results.
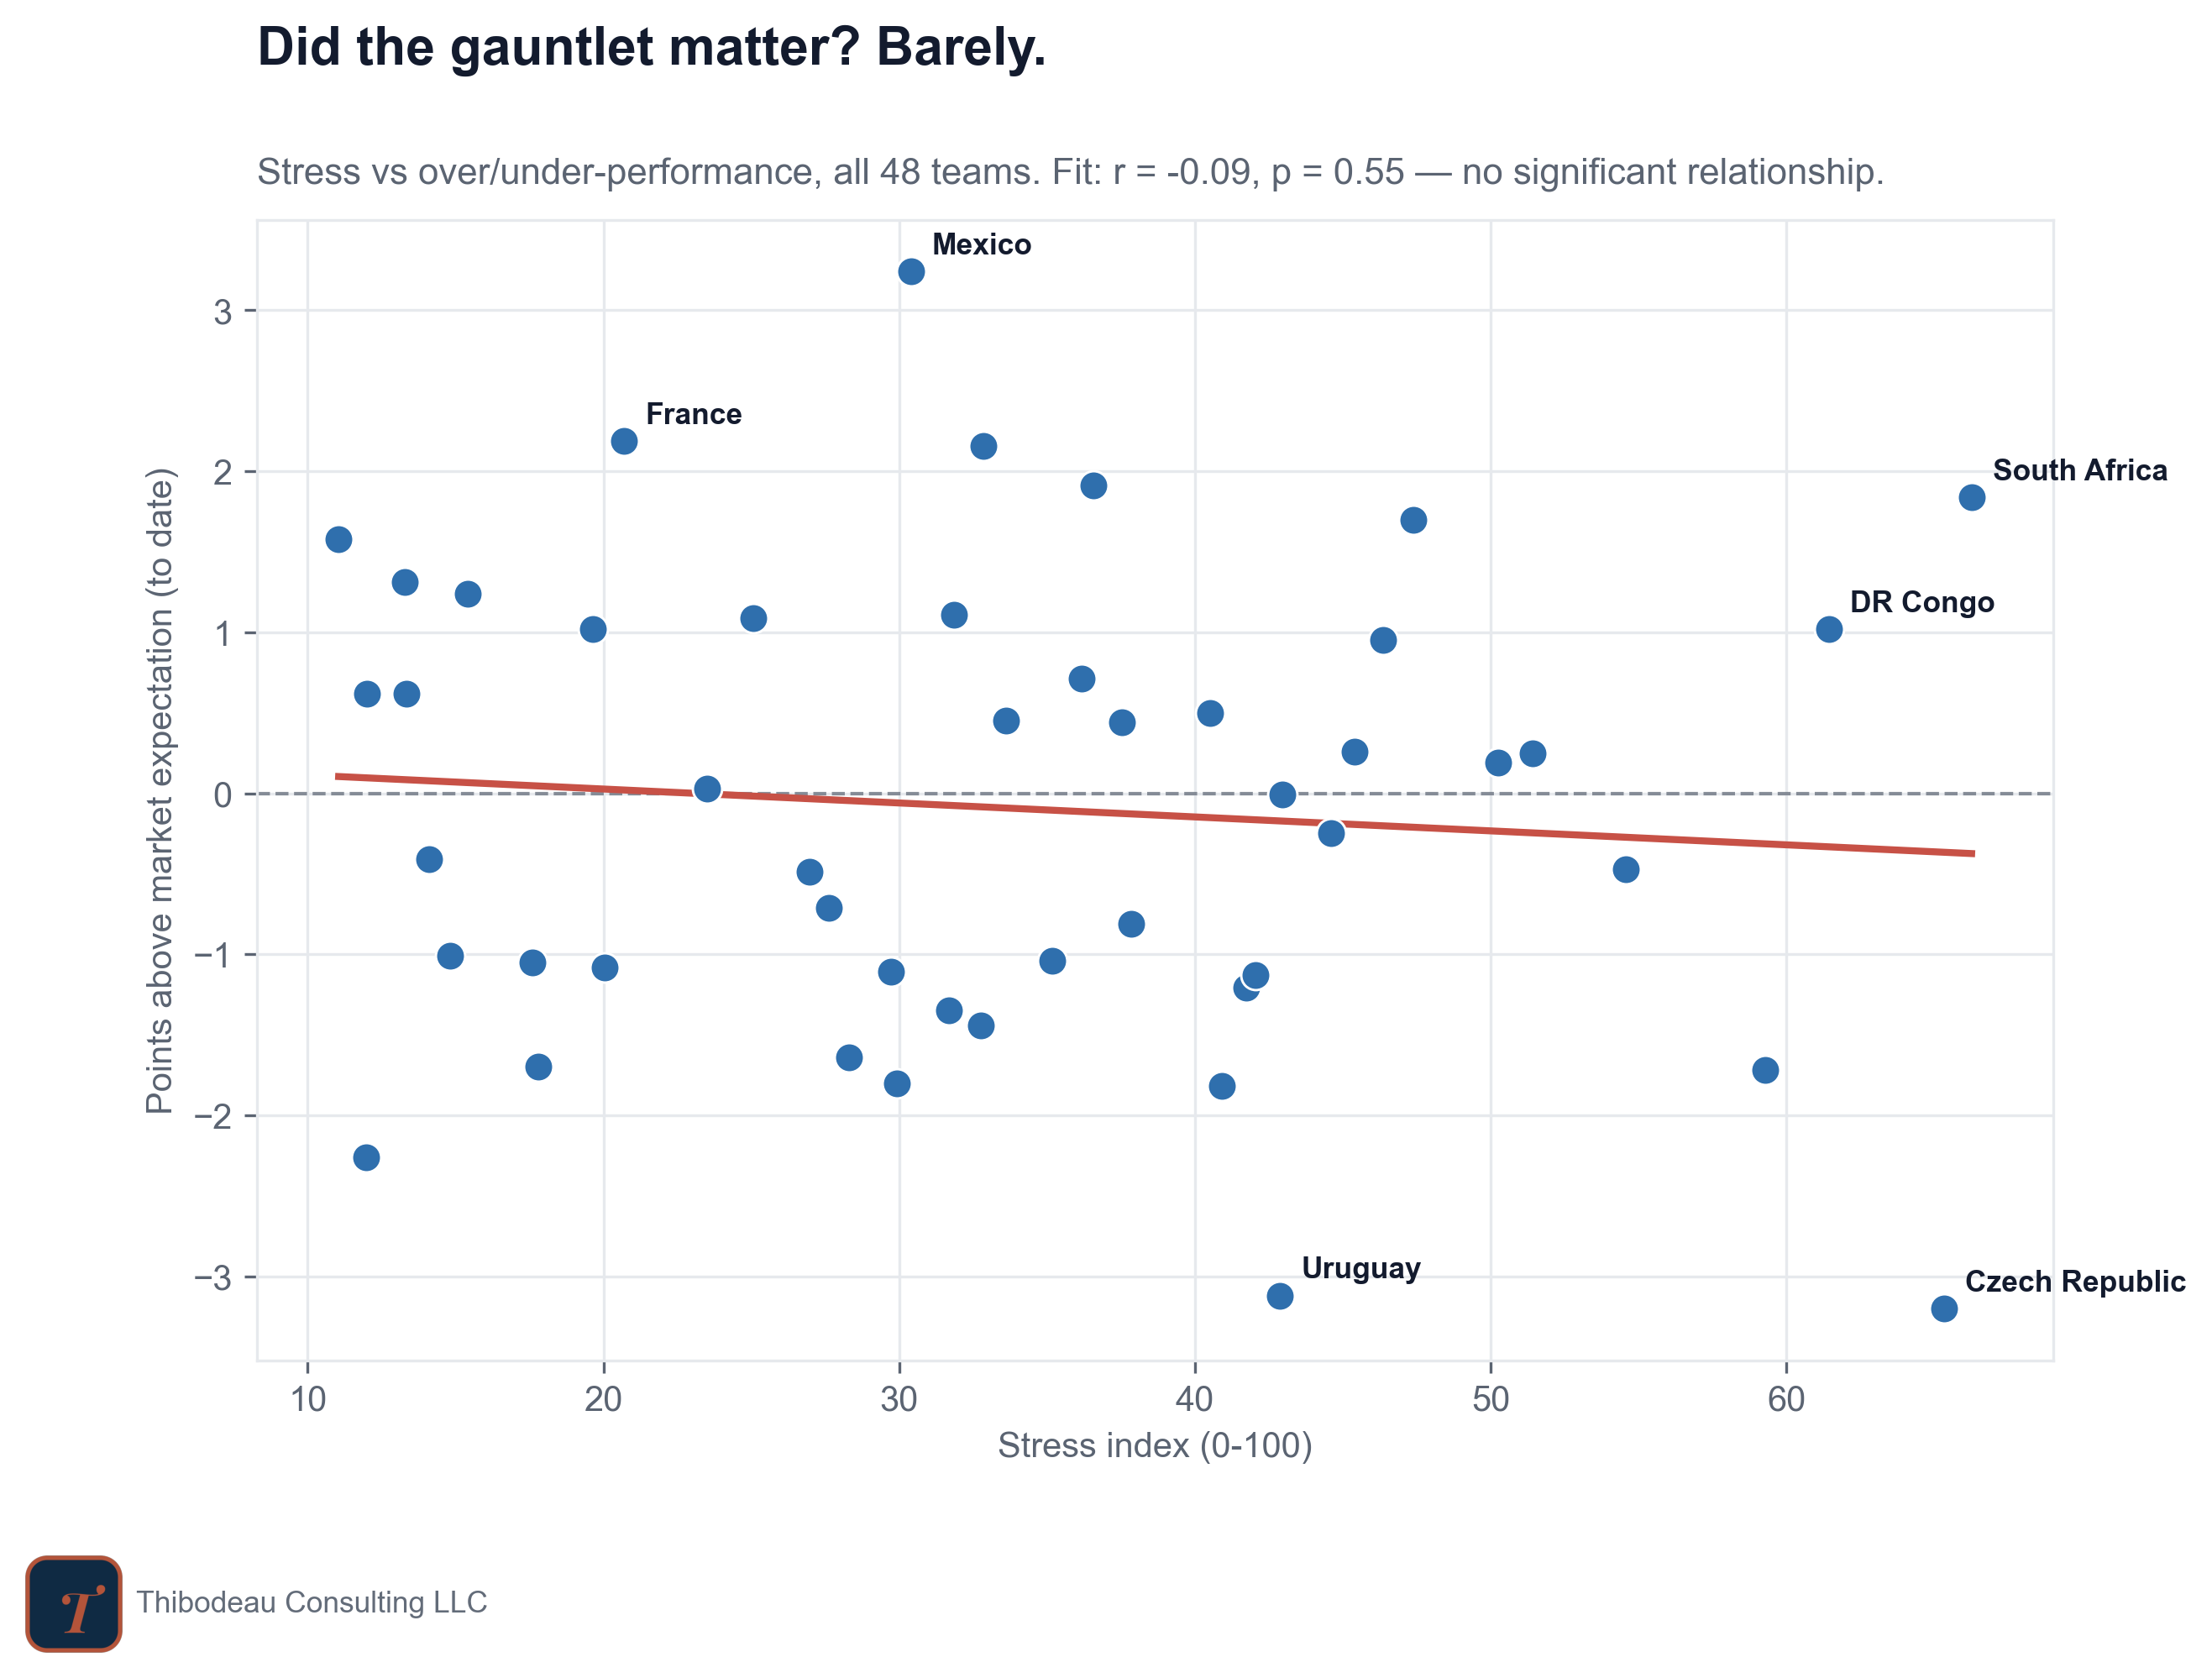
“The brutal schedule is deciding games.” Verdict: no.
This was the storyline most tempting to believe, so it is worth slowing down to talk a bit more about how we defined it. For every team we built a stress index out of the five things pundits pointed to as a challenge for teams: how far they flew, how hot their venues ran, how much altitude they climbed, how often they were pushed onto artificial turf, and how many time zones their body clocks crossed. Each piece is scored from 0 to 100 across the 48 teams and then averaged, so a team’s number is its rank on punishment, not a raw tally of miles and degrees.
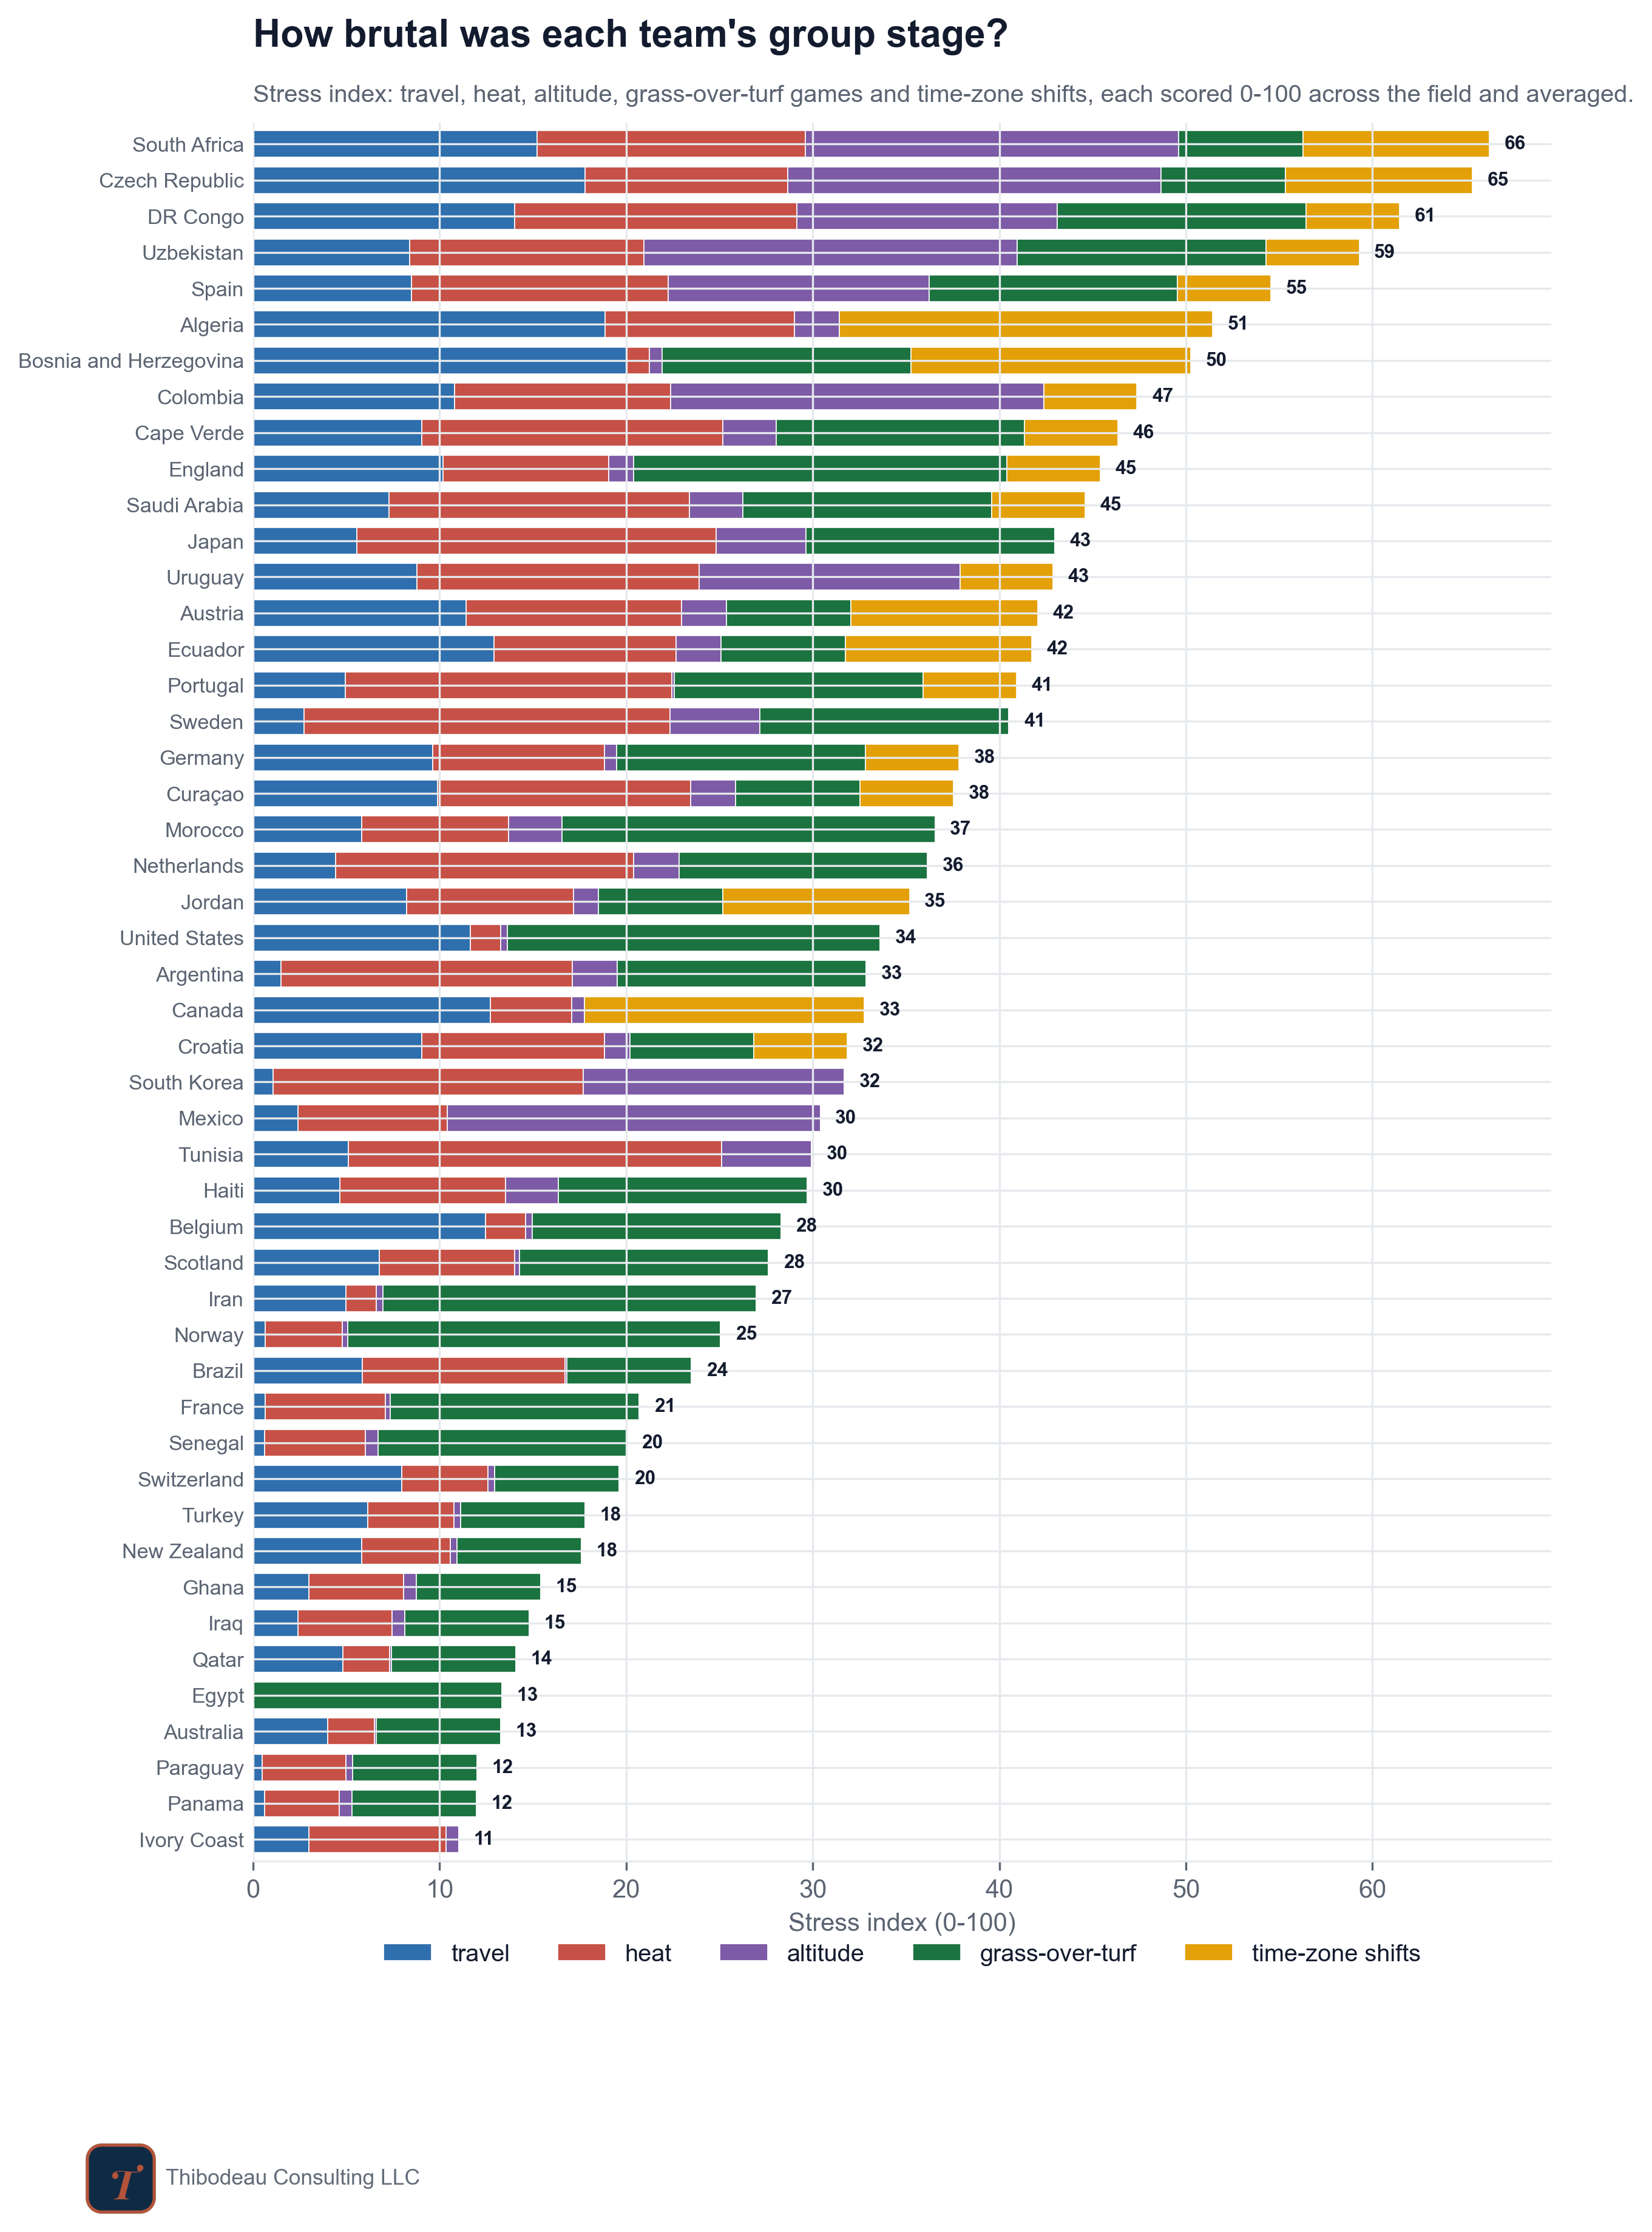
The spread is enormous. South Africa drew the most brutal schedule in the field at 66, a long-haul, high-altitude, turf-heavy grind. Ivory Coast had the gentlest at 11, barely a sixth as taxing. And “brutal” meant different things to different teams: Algeria’s score is travel and time zones, Spain’s is altitude, Brazil’s and Bosnia’s is the flying, Egypt’s is almost entirely the turf.
Then line that ranking up against what teams actually did, and the relationship simply is not there. The stress index tracks performance somewhere between −0.13 and zero. Travel and time-zone shift lean faintly in the intuitive direction, more isolation, marginally worse, but at noise level; heat and altitude are flat. The teams with the worst draws did not wilt, and the teams with the easiest ones did not run away. South Africa, handed the single most punishing schedule in the tournament, walked out of its group as a runner-up. Whatever the trip did to the players’ legs, it did not show up in the points.
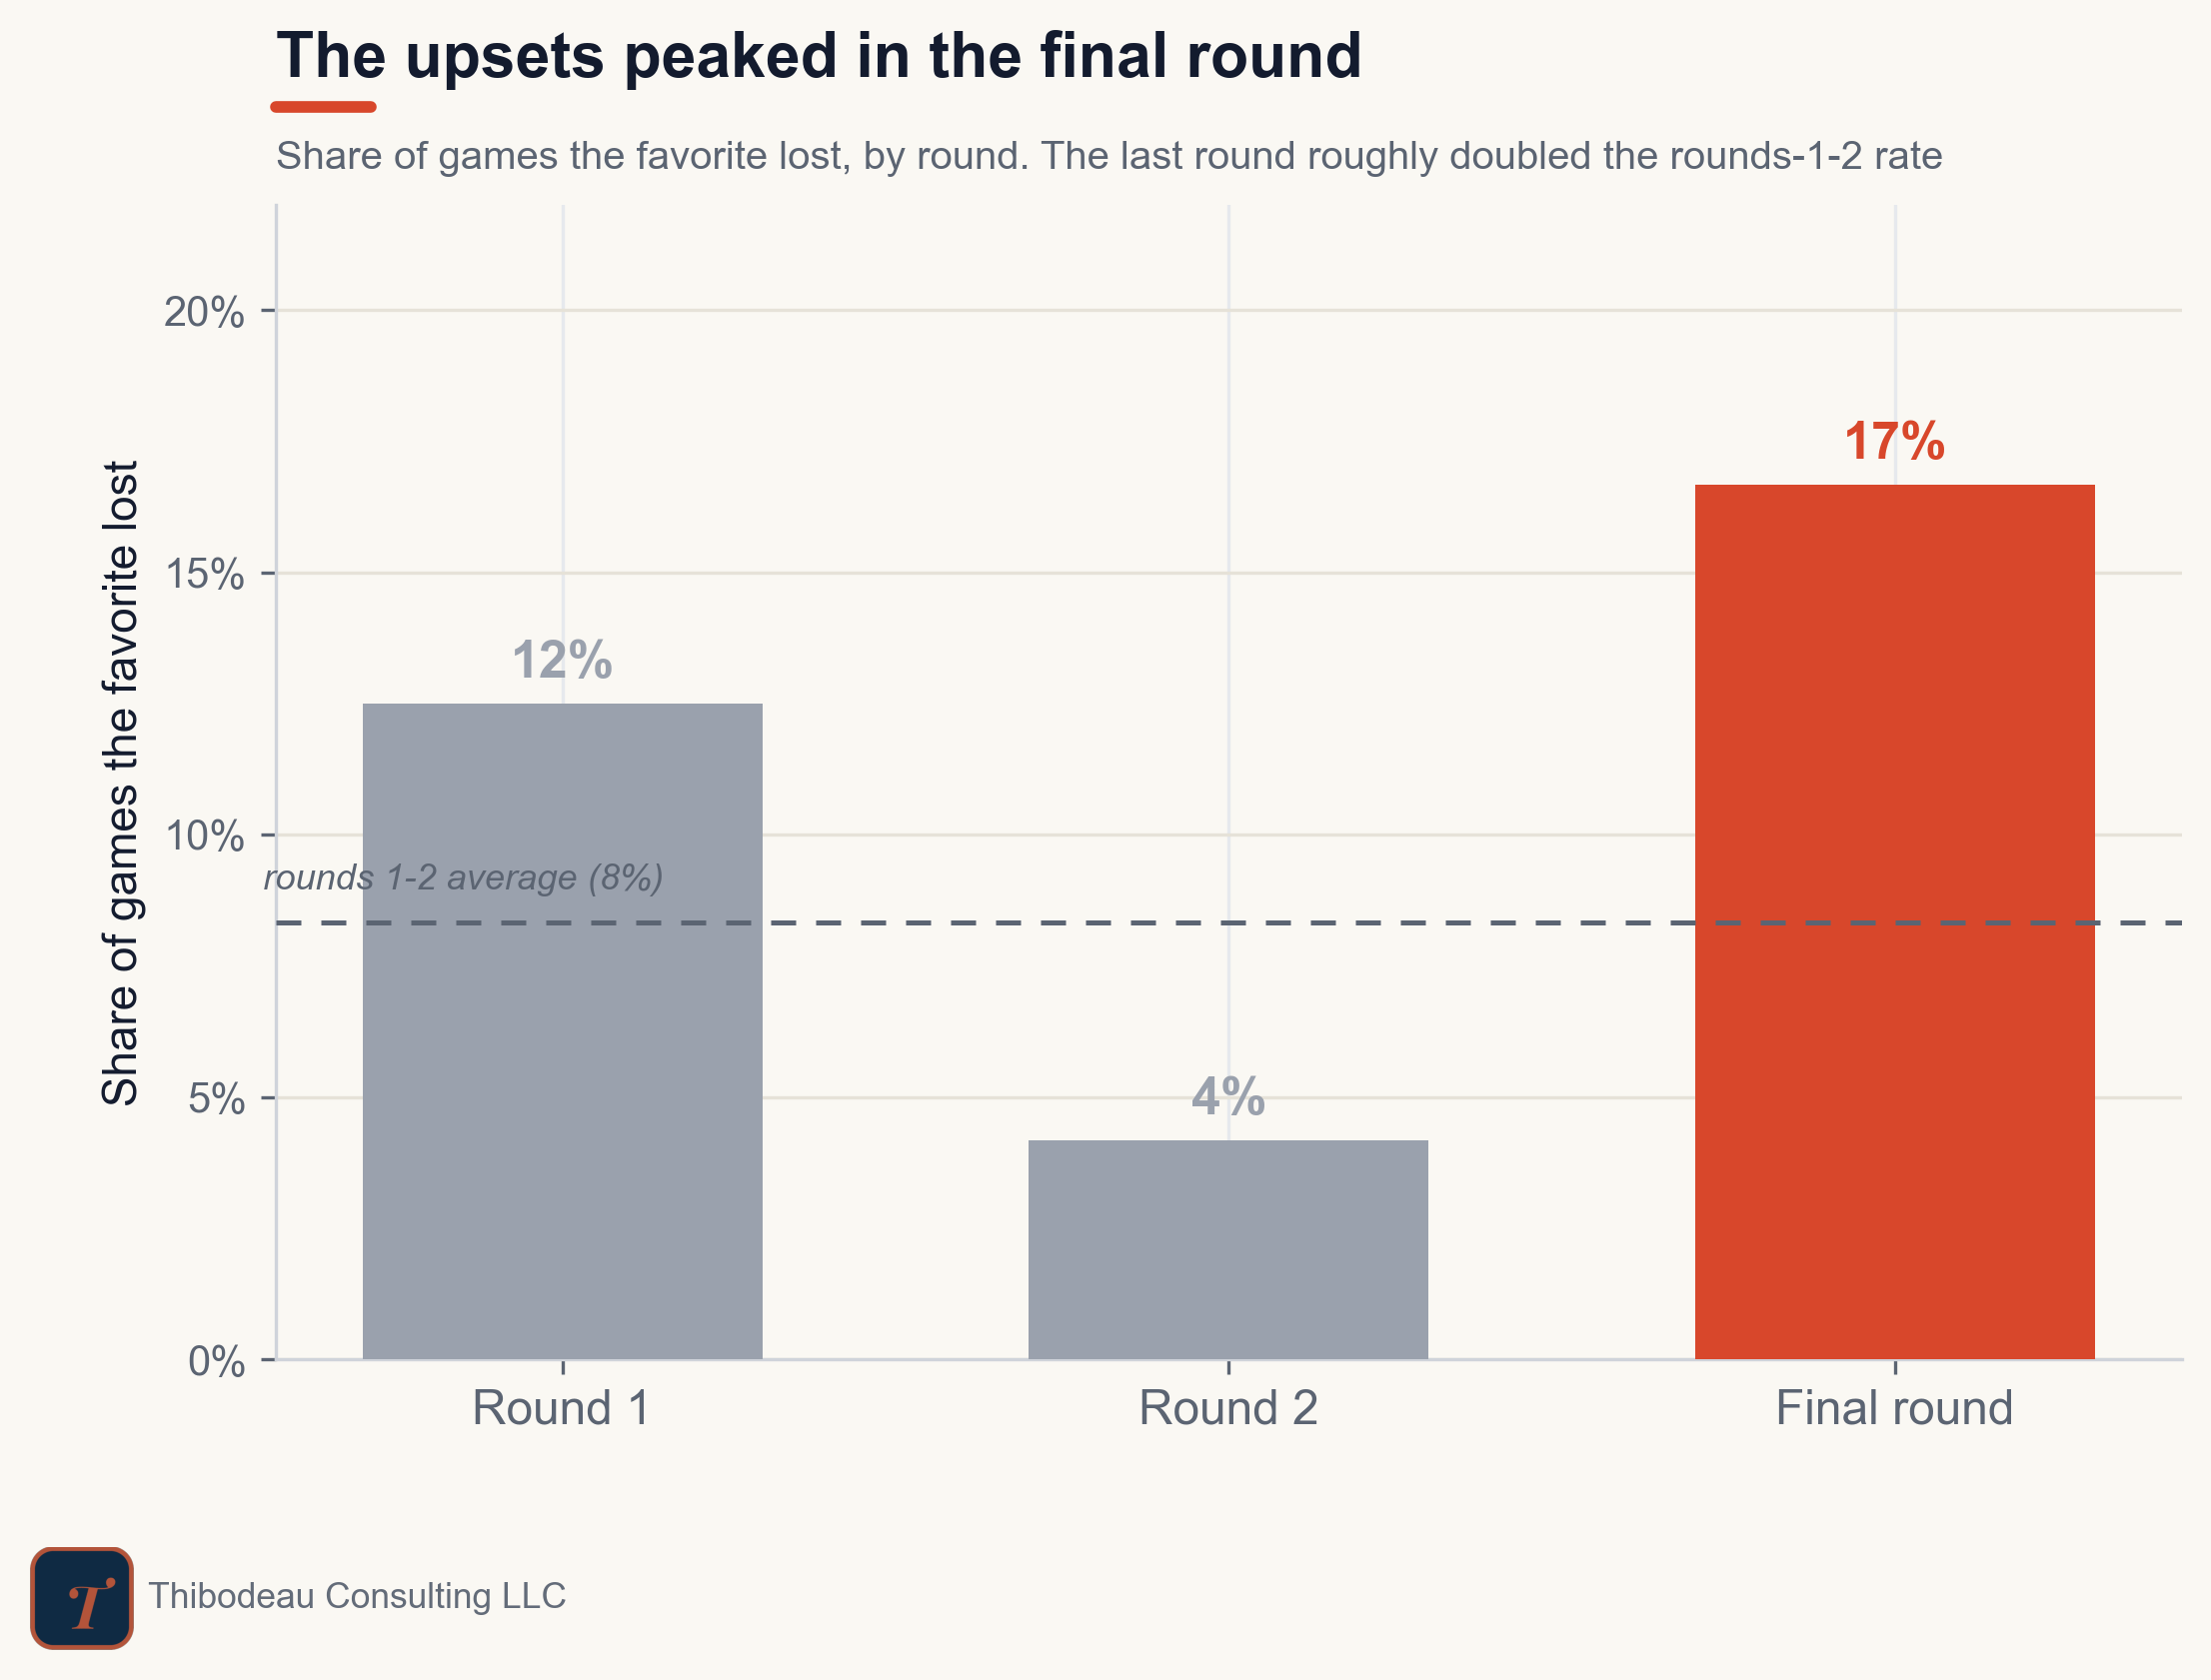
“It’s been a tournament of chaos.” Verdict: barely, and mostly at the end.
The upsets felt constant. They were not.
The higher-rated team avoided defeat 89 percent of the time, and 97 percent once its Elo edge cleared 200 points, where outright upsets essentially disappeared. Across all 72 group games, the stronger side lost outright just eight times total.
The chaos that did happen mostly clustered in the final round. Teams already safely through rotated their lineups and quietly underperformed the market, and the upset rate in that last round roughly doubled the rest of the group stage. The disorder lived exactly where the incentives went soft.
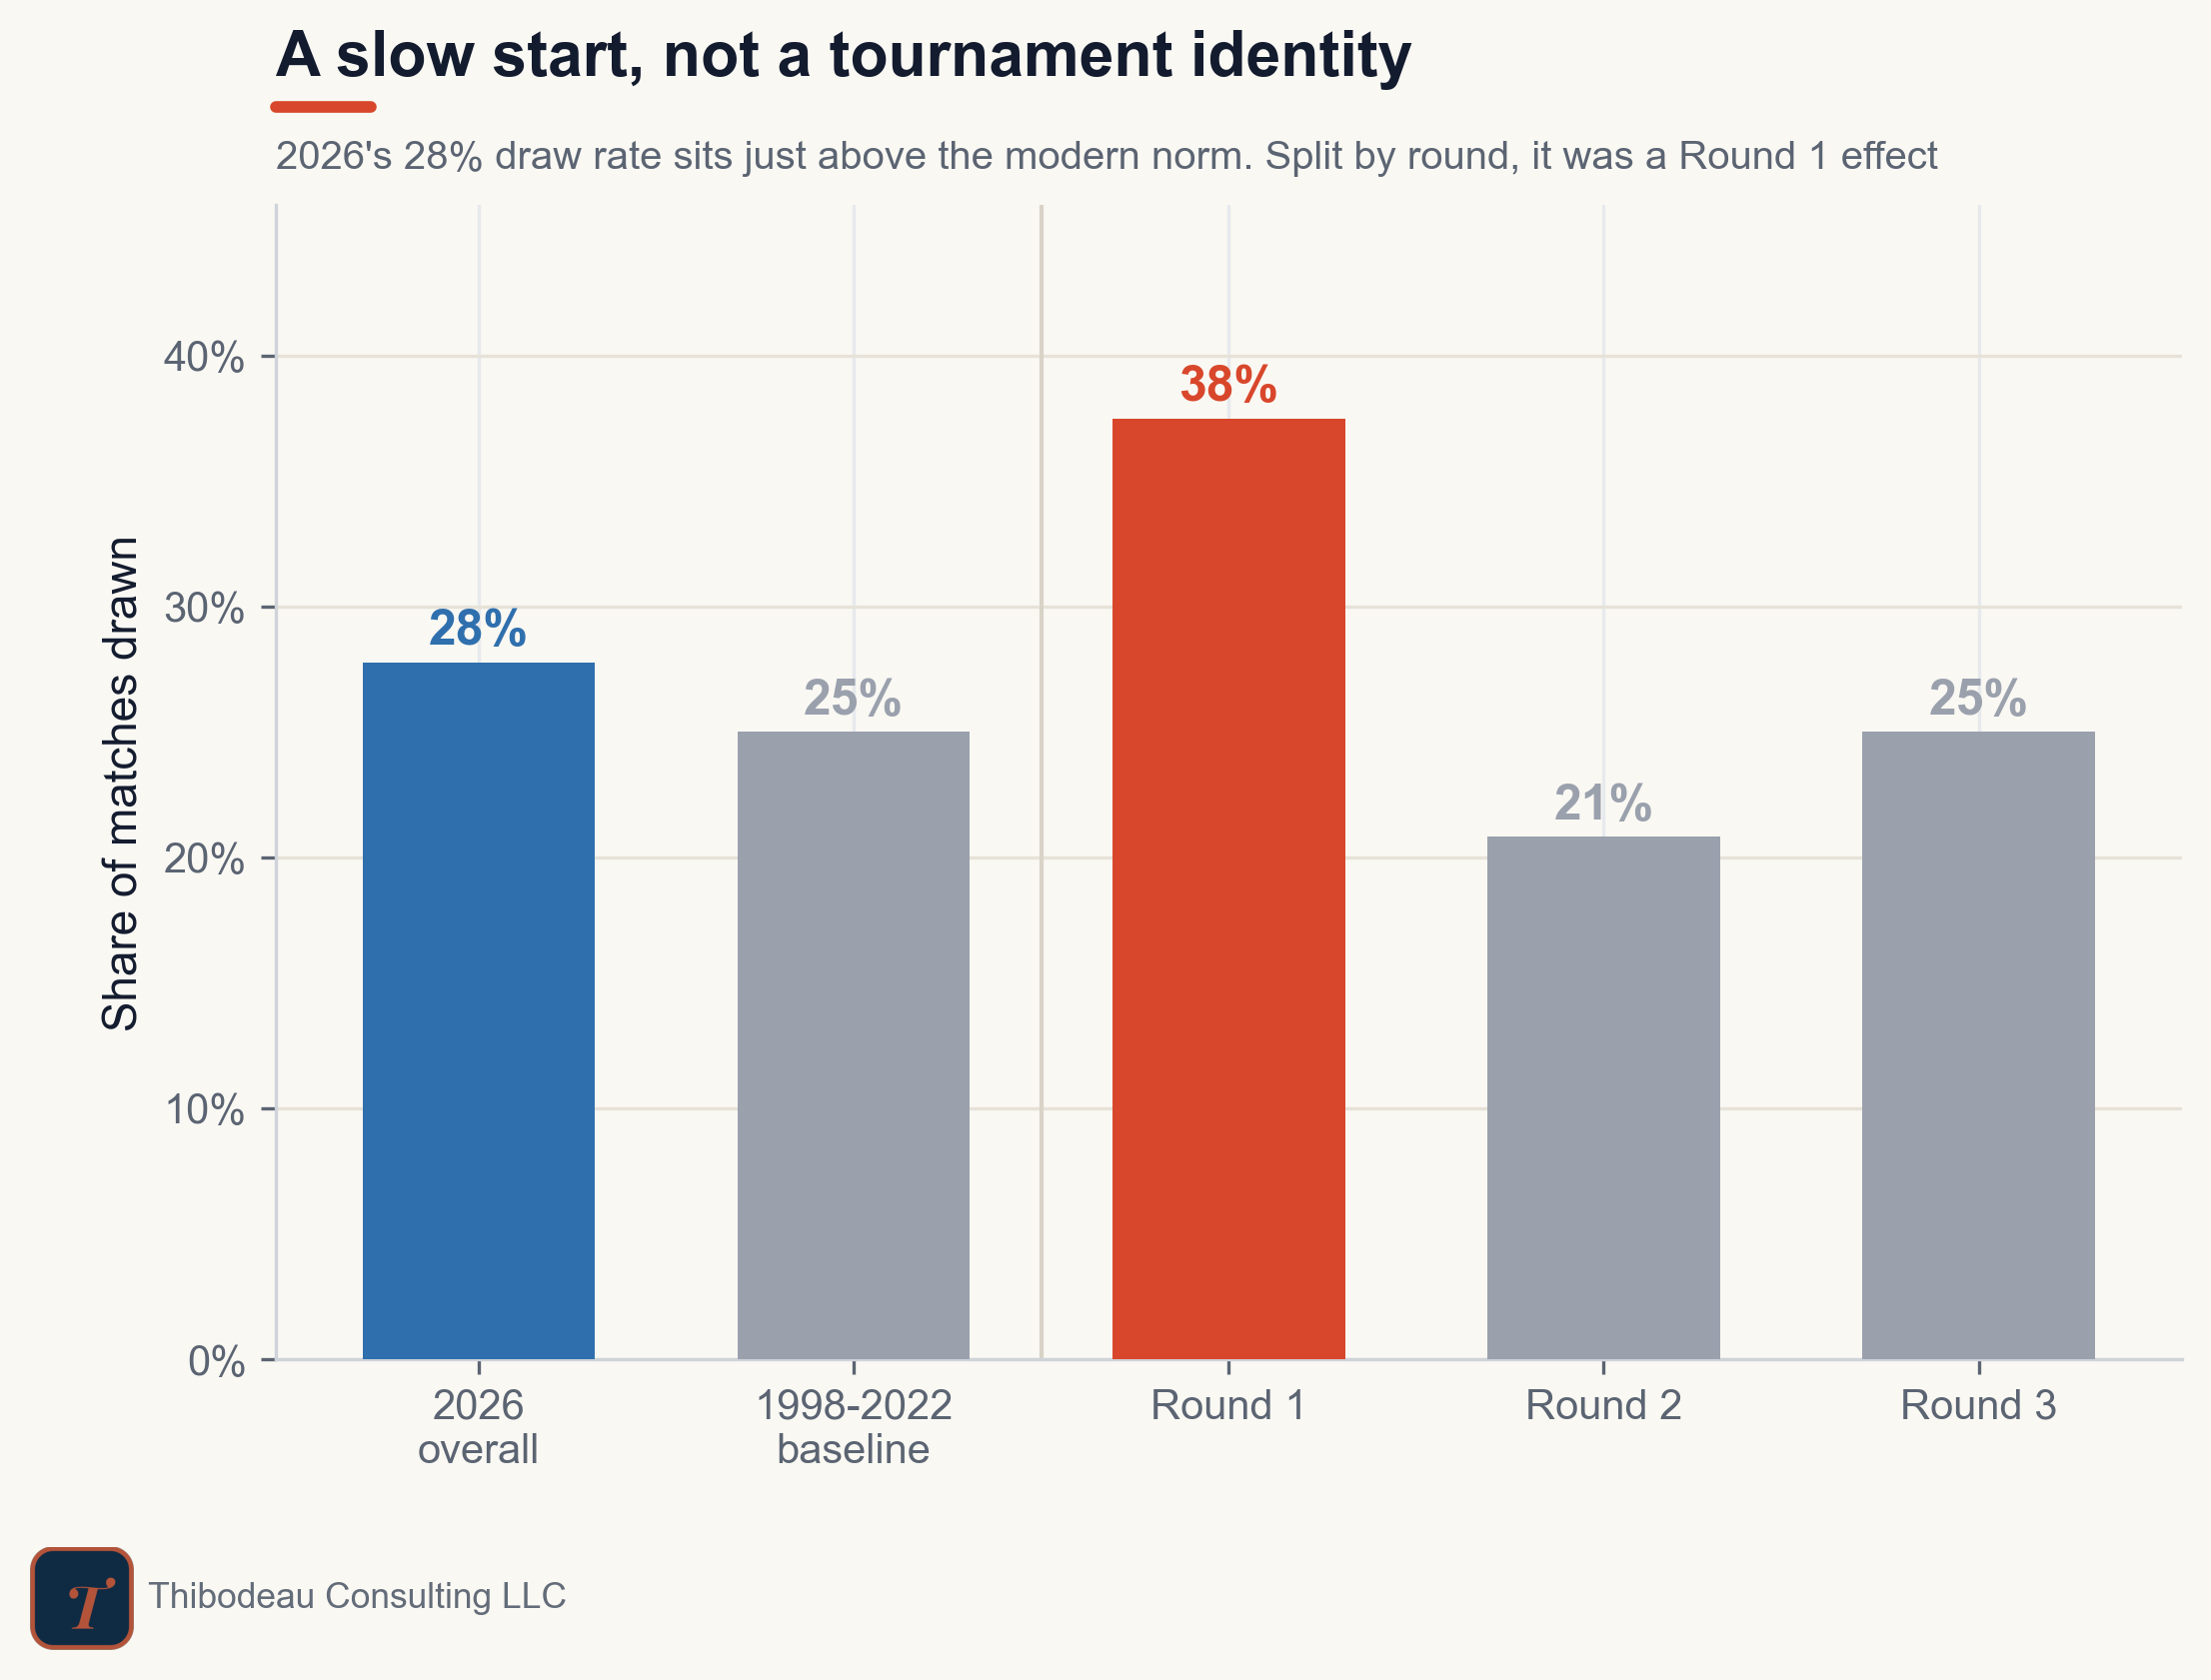
“The draws are killing it.” Verdict: overstated.
Draws ran at 28 percent of matches, which is high but not wild for group play, against a modern World Cup group-stage baseline near 25 percent.
The real story is timing. Round 1 drew at 38 percent, as teams felt each other out. Then the rate fell once the table forced the issue. It was a slow start, not a tournament identity.
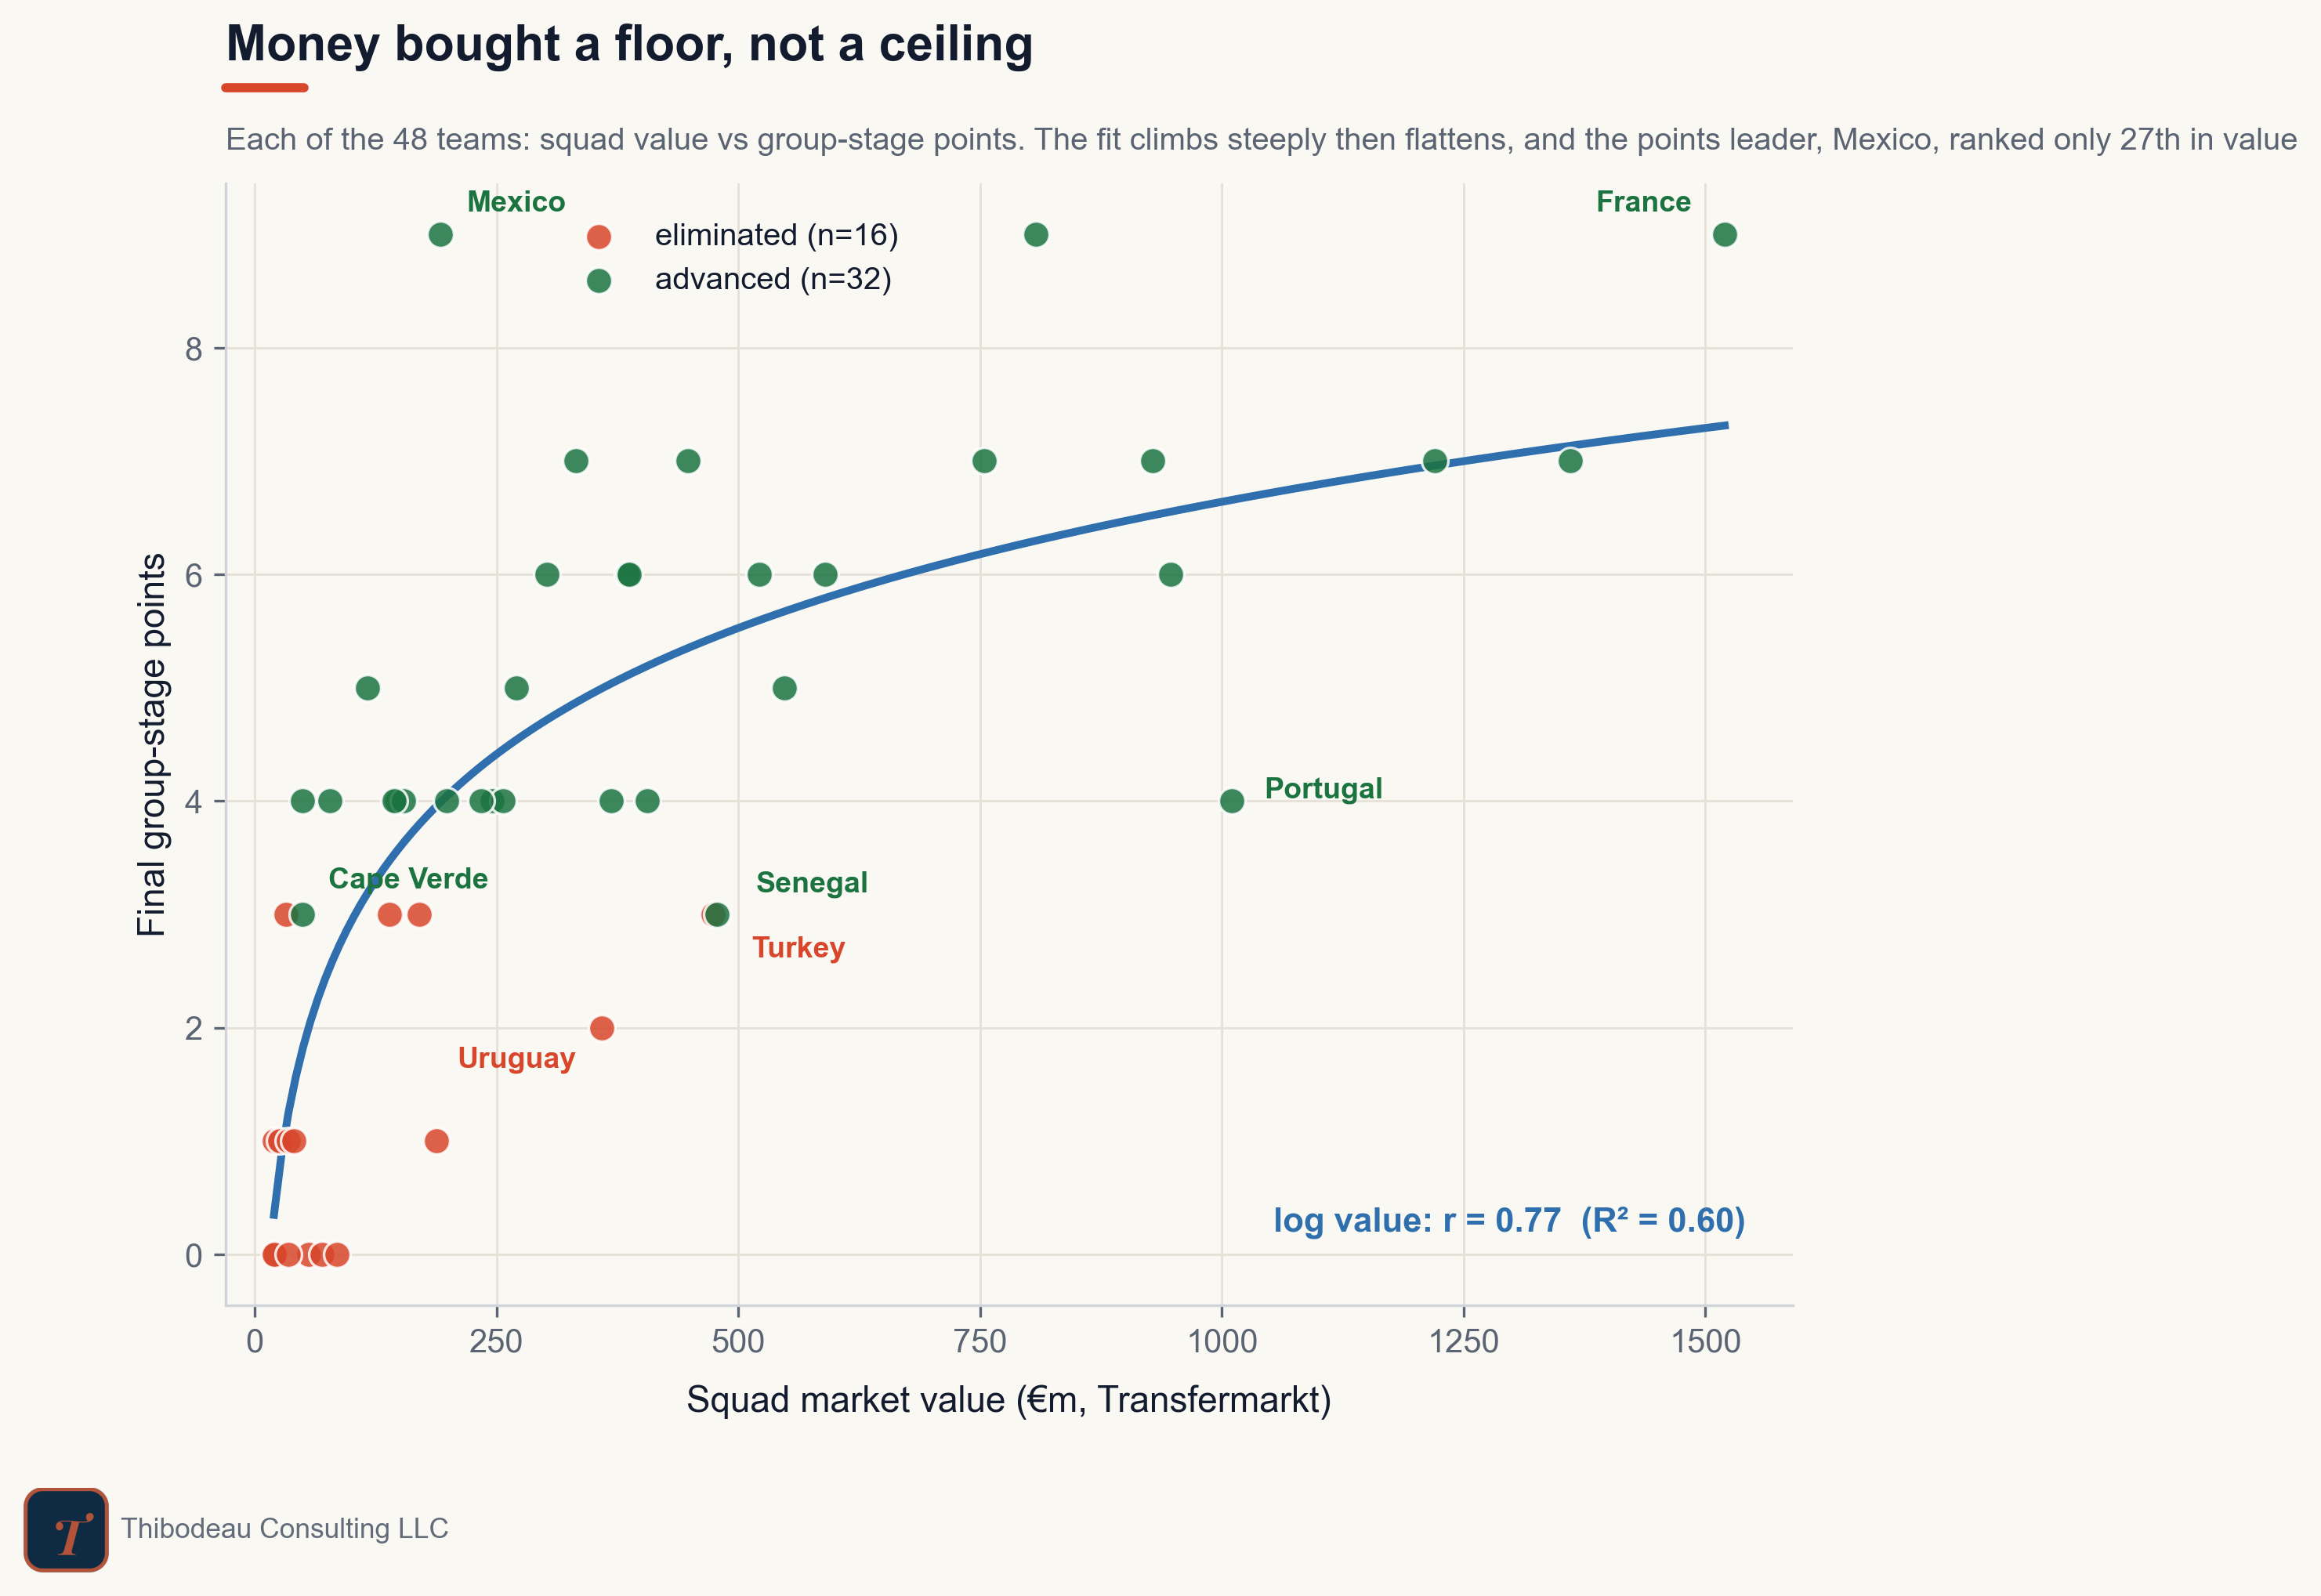
“Squad value doesn’t matter anymore.” Verdict: backwards.
Of everything we measured, squad value drew the cleanest line of all. The cheapest sixteen squads sent only a quarter of their teams through. The middle tier sent 81 percent. The richest sixteen sent 94 percent.
The curve is concave, which matters. Going from €20 million to €200 million is enormous. Going from €1 billion to €1.5 billion barely moves the needle. But the broad lesson is not subtle: the underdogs did not take over the group stage. The deeper, more expensive squads did.
That lines up with a long-running finding in soccer analytics: squad market value is a blunt but powerful predictor of international performance. It captures talent and depth in a way results-only ratings sometimes miss, especially when teams come through very different qualifying paths. That makes it the obvious next ingredient for DSWC Pro as we move into the knockout round.
“So the big dogs are cruising.” Verdict: half-right.
Here is the twist that makes the money story interesting. Strength told you who would not lose. It told you much less about who would win.
The stronger teams mostly survived, but they did not always separate. Spain drew Cape Verde. England drew Ghana. Ecuador drew Curaçao. Colombia drew Portugal. Those games were not all equal matchups. They were reminders that a rating edge buys a floor, not a scoreline.
Squad value missed plenty too. Mexico, only 27th in squad value, won its group with nine points. Turkey, 13th, went home. Portugal, the priciest squad to disappoint at more than a billion euros, scraped four points and finished second.
Strength sorted survival, but it did not guarantee dominance.
Putting it all together
Of everything we measured, two things tracked the table and the rest barely registered. Squad value correlated with points at r = 0.77. Elo rating followed at r = 0.68. The entire conditions family sat near zero.
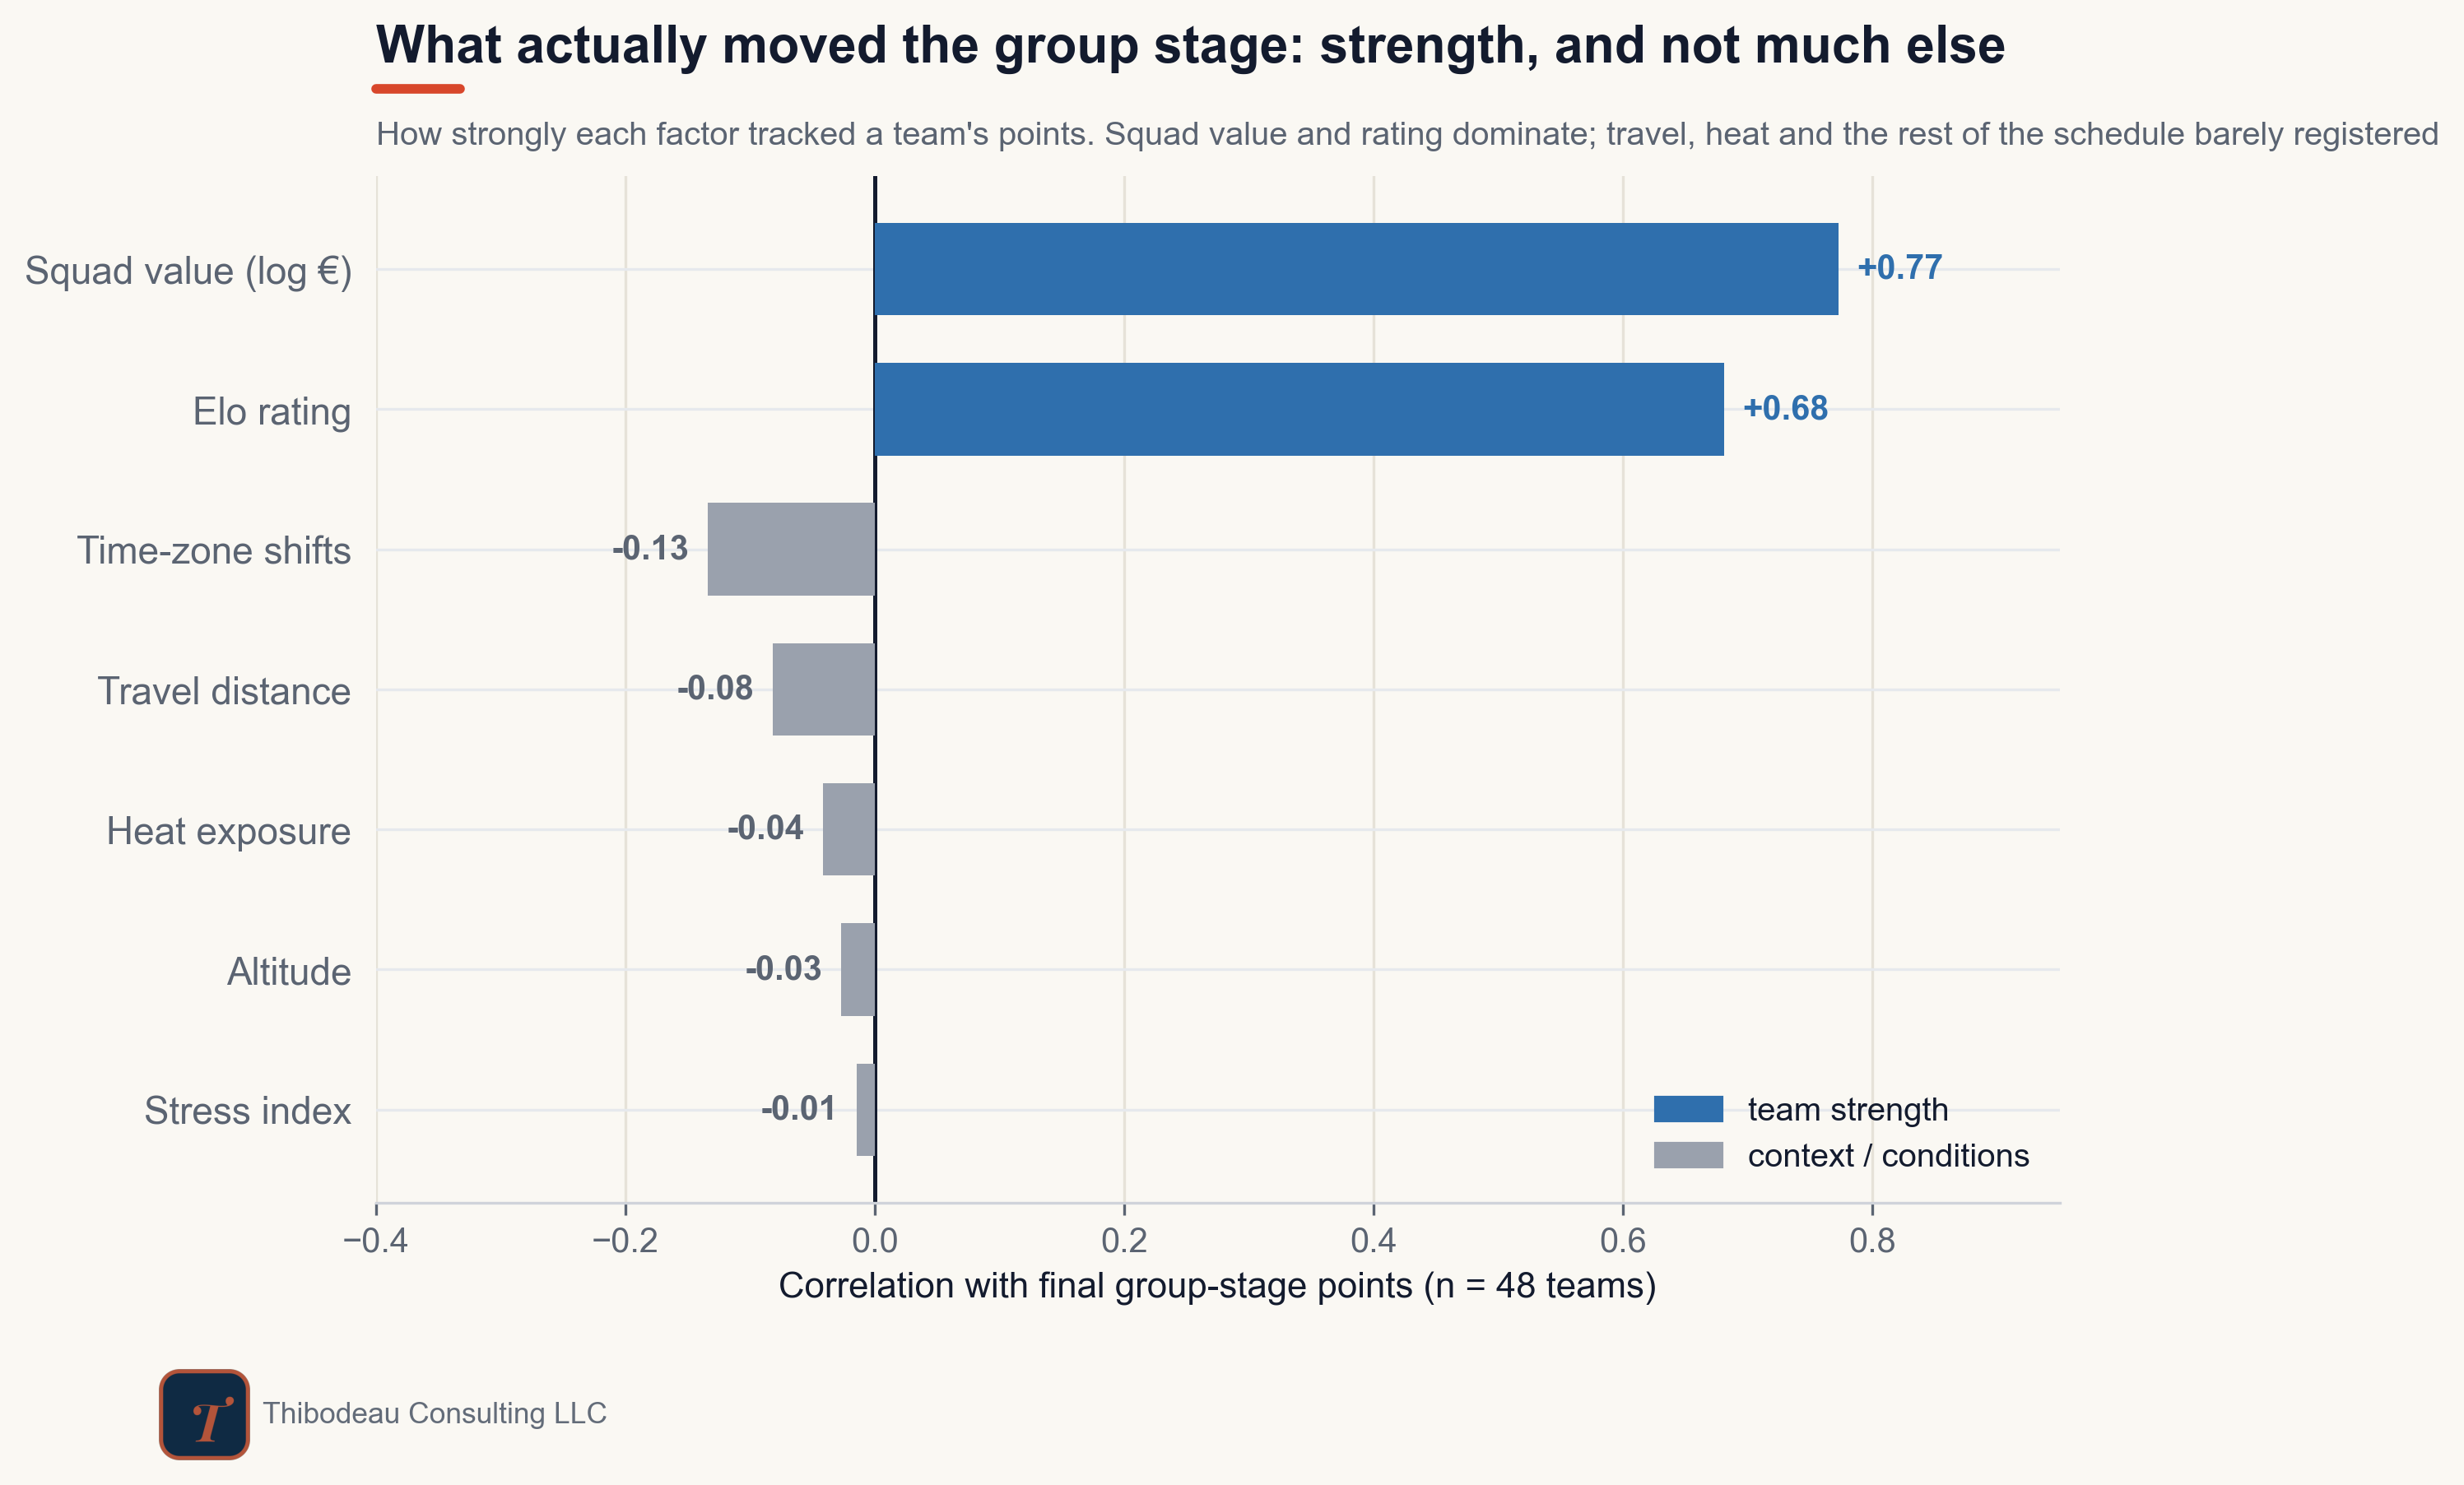
So the group stage was a strength story with a twist. Squad value and ratings did most of the sorting. They said much less about margins, draws, and the handful of shocks. Heat and travel made for a compelling narrative, but not a convincing statistical explanation. The real chaos came from table state, especially once teams had already booked their places.
That is worth holding onto as the knockouts begin, because single elimination strips out the one factor that misbehaved. No waiting room. No third-place escape hatch. Everyone has everything to play for.
Today’s Scorecard and Forecasts
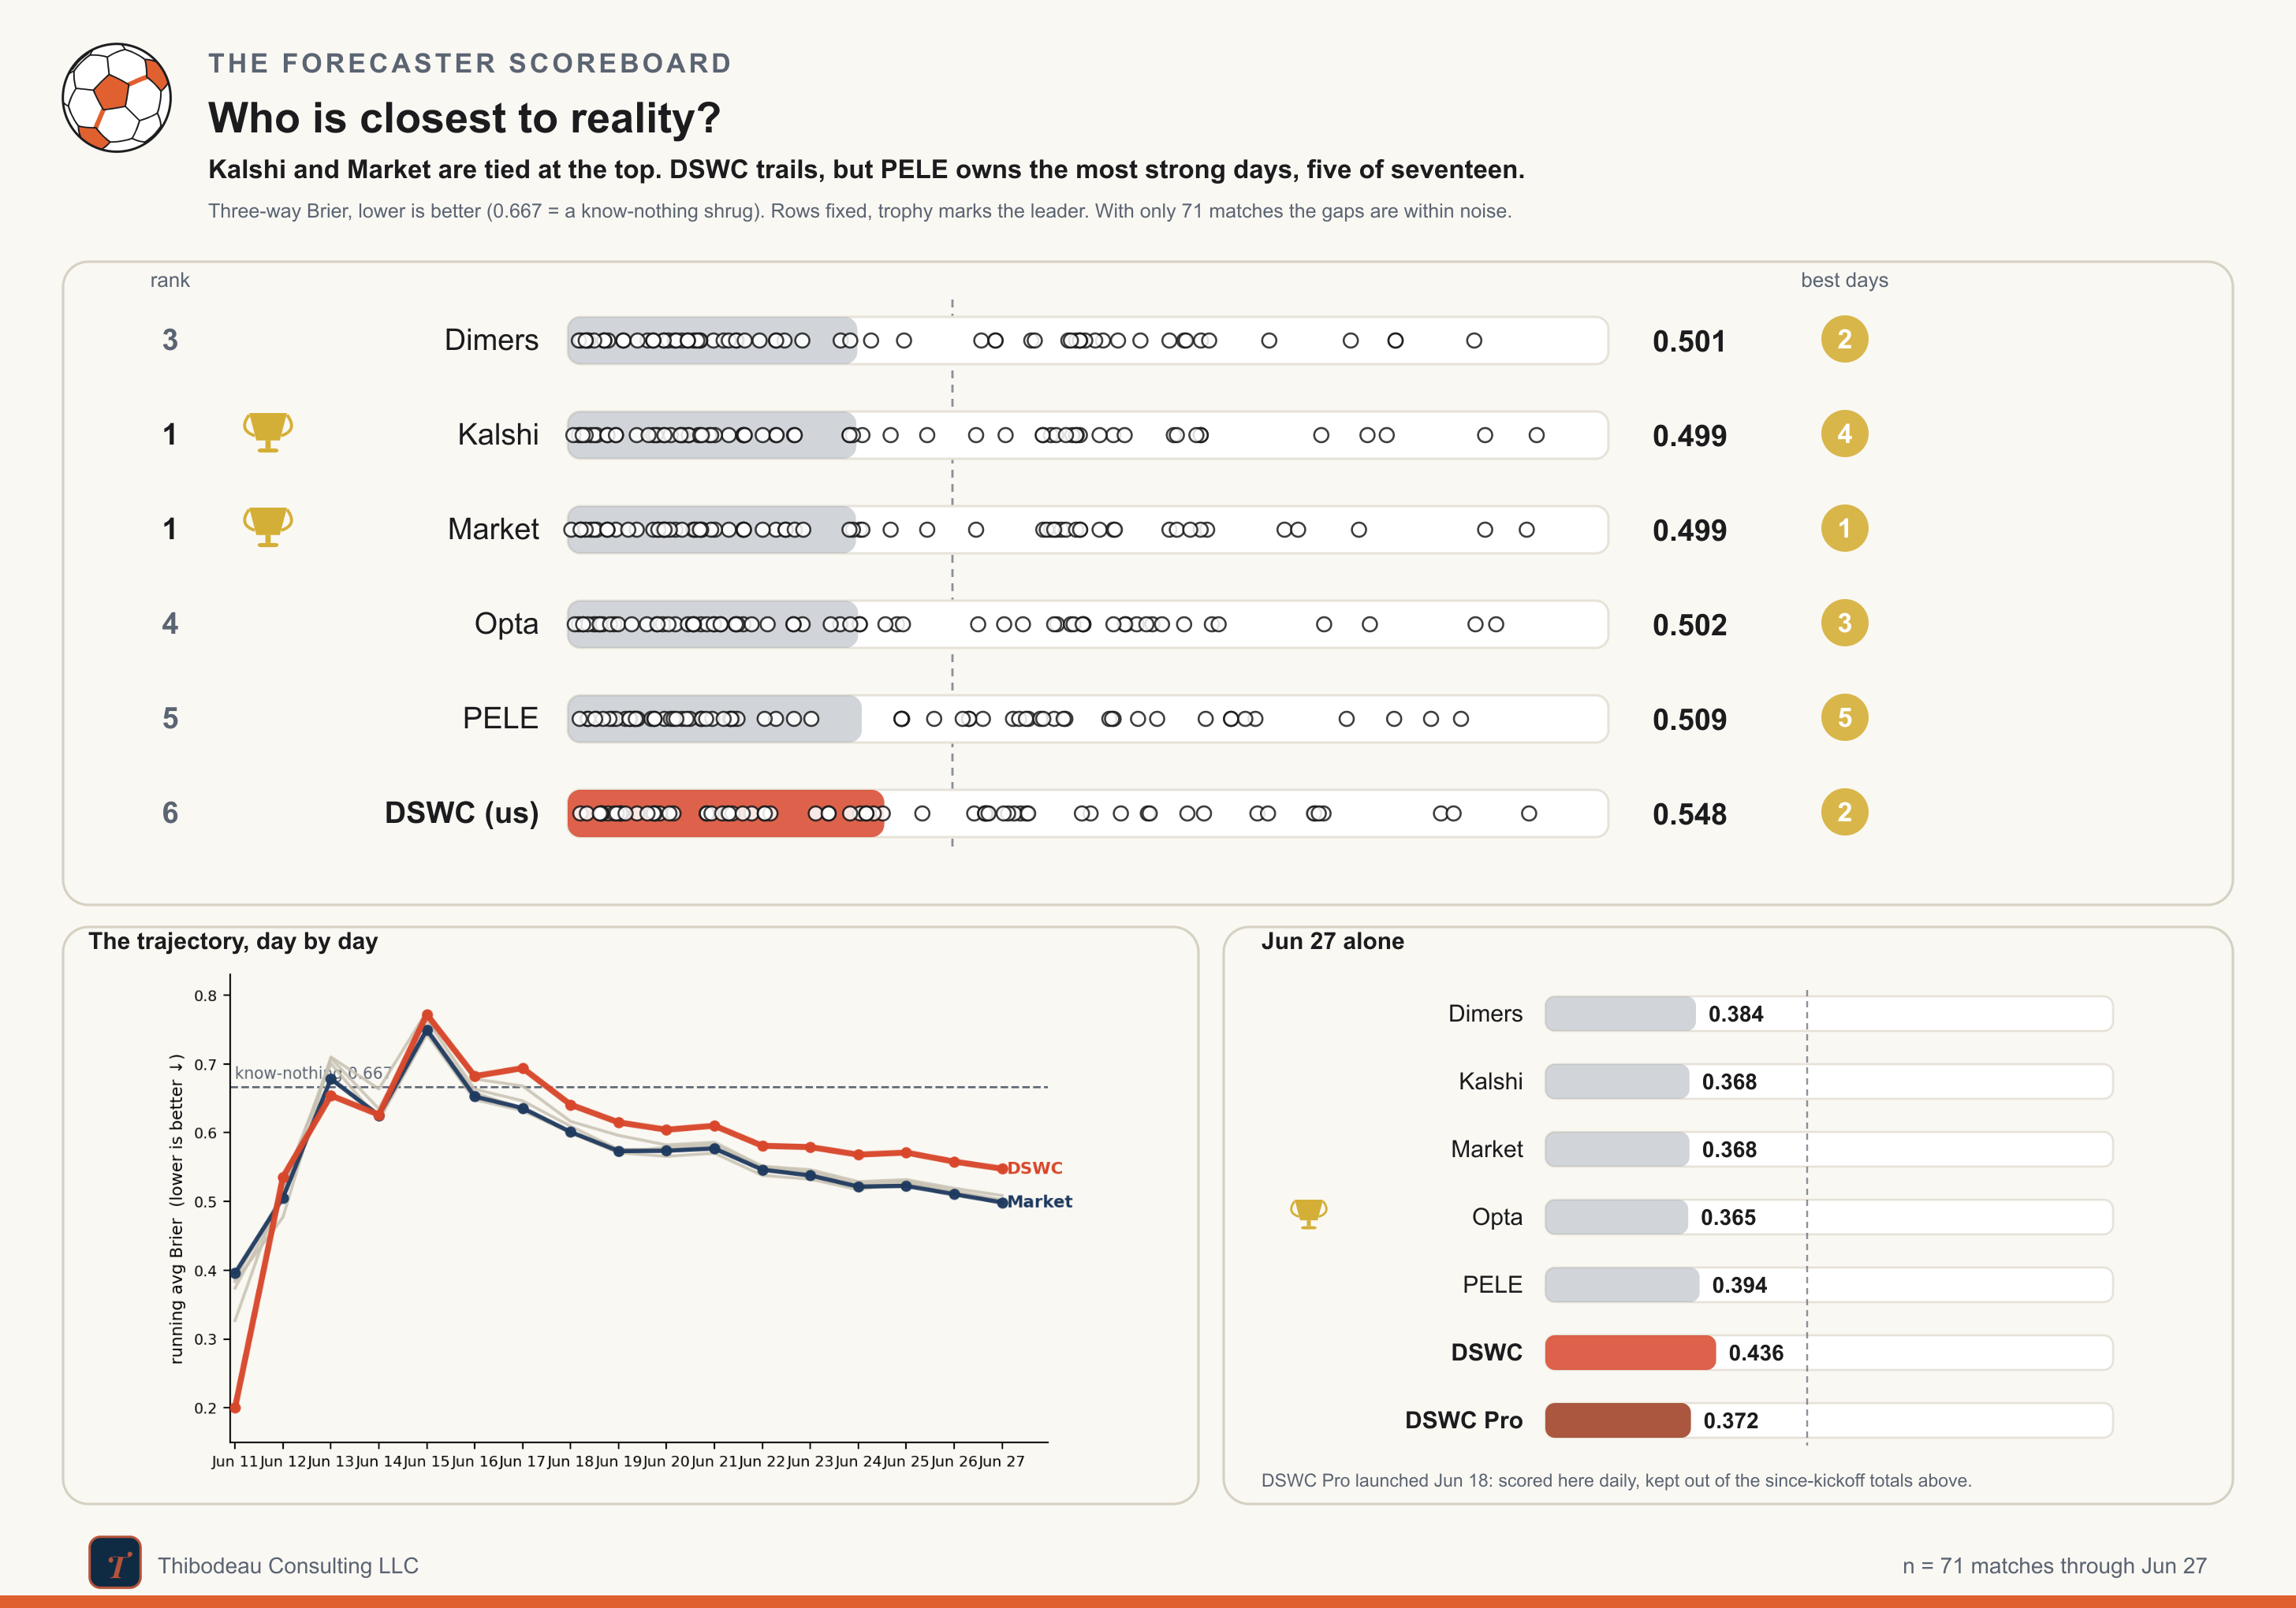
The group stage closed the forecaster competition along with everything else, so here is the final tally. Across all graded group games, the betting market and Kalshi finished tied at the top, both at 0.499 average Brier. Dimers was right behind at 0.501, then Opta at 0.502 and PELE at 0.509. Our results-only model finished last at 0.548, about five hundredths of a point per game behind the market.
The final day fit the pattern. Opta posted the cleanest card of the last group round, at 0.365. The market and Kalshi were next at 0.368. Classic finished last at 0.436, punished by the Algeria-Austria 3-3 and Colombia-Portugal 0-0, exactly the kind of draw-heavy, high-variance games where a results-only forecast tends to wobble.
For the matches after DSWC Pro launched, the standings look a little different. Since June 18, Kalshi leads at 0.429, with PELE at 0.432, the market at 0.433, and Dimers and DSWC Pro tied at 0.436. Opta sits just behind at 0.440, while the old results-only model is last at 0.477.
That is the useful split. Pro did not win the group stage, but on the 48 matches where it existed, it moved us from clearly last into the public-forecaster pack. We’ll continue competing with Pro in the knockout stage and scoring the results.
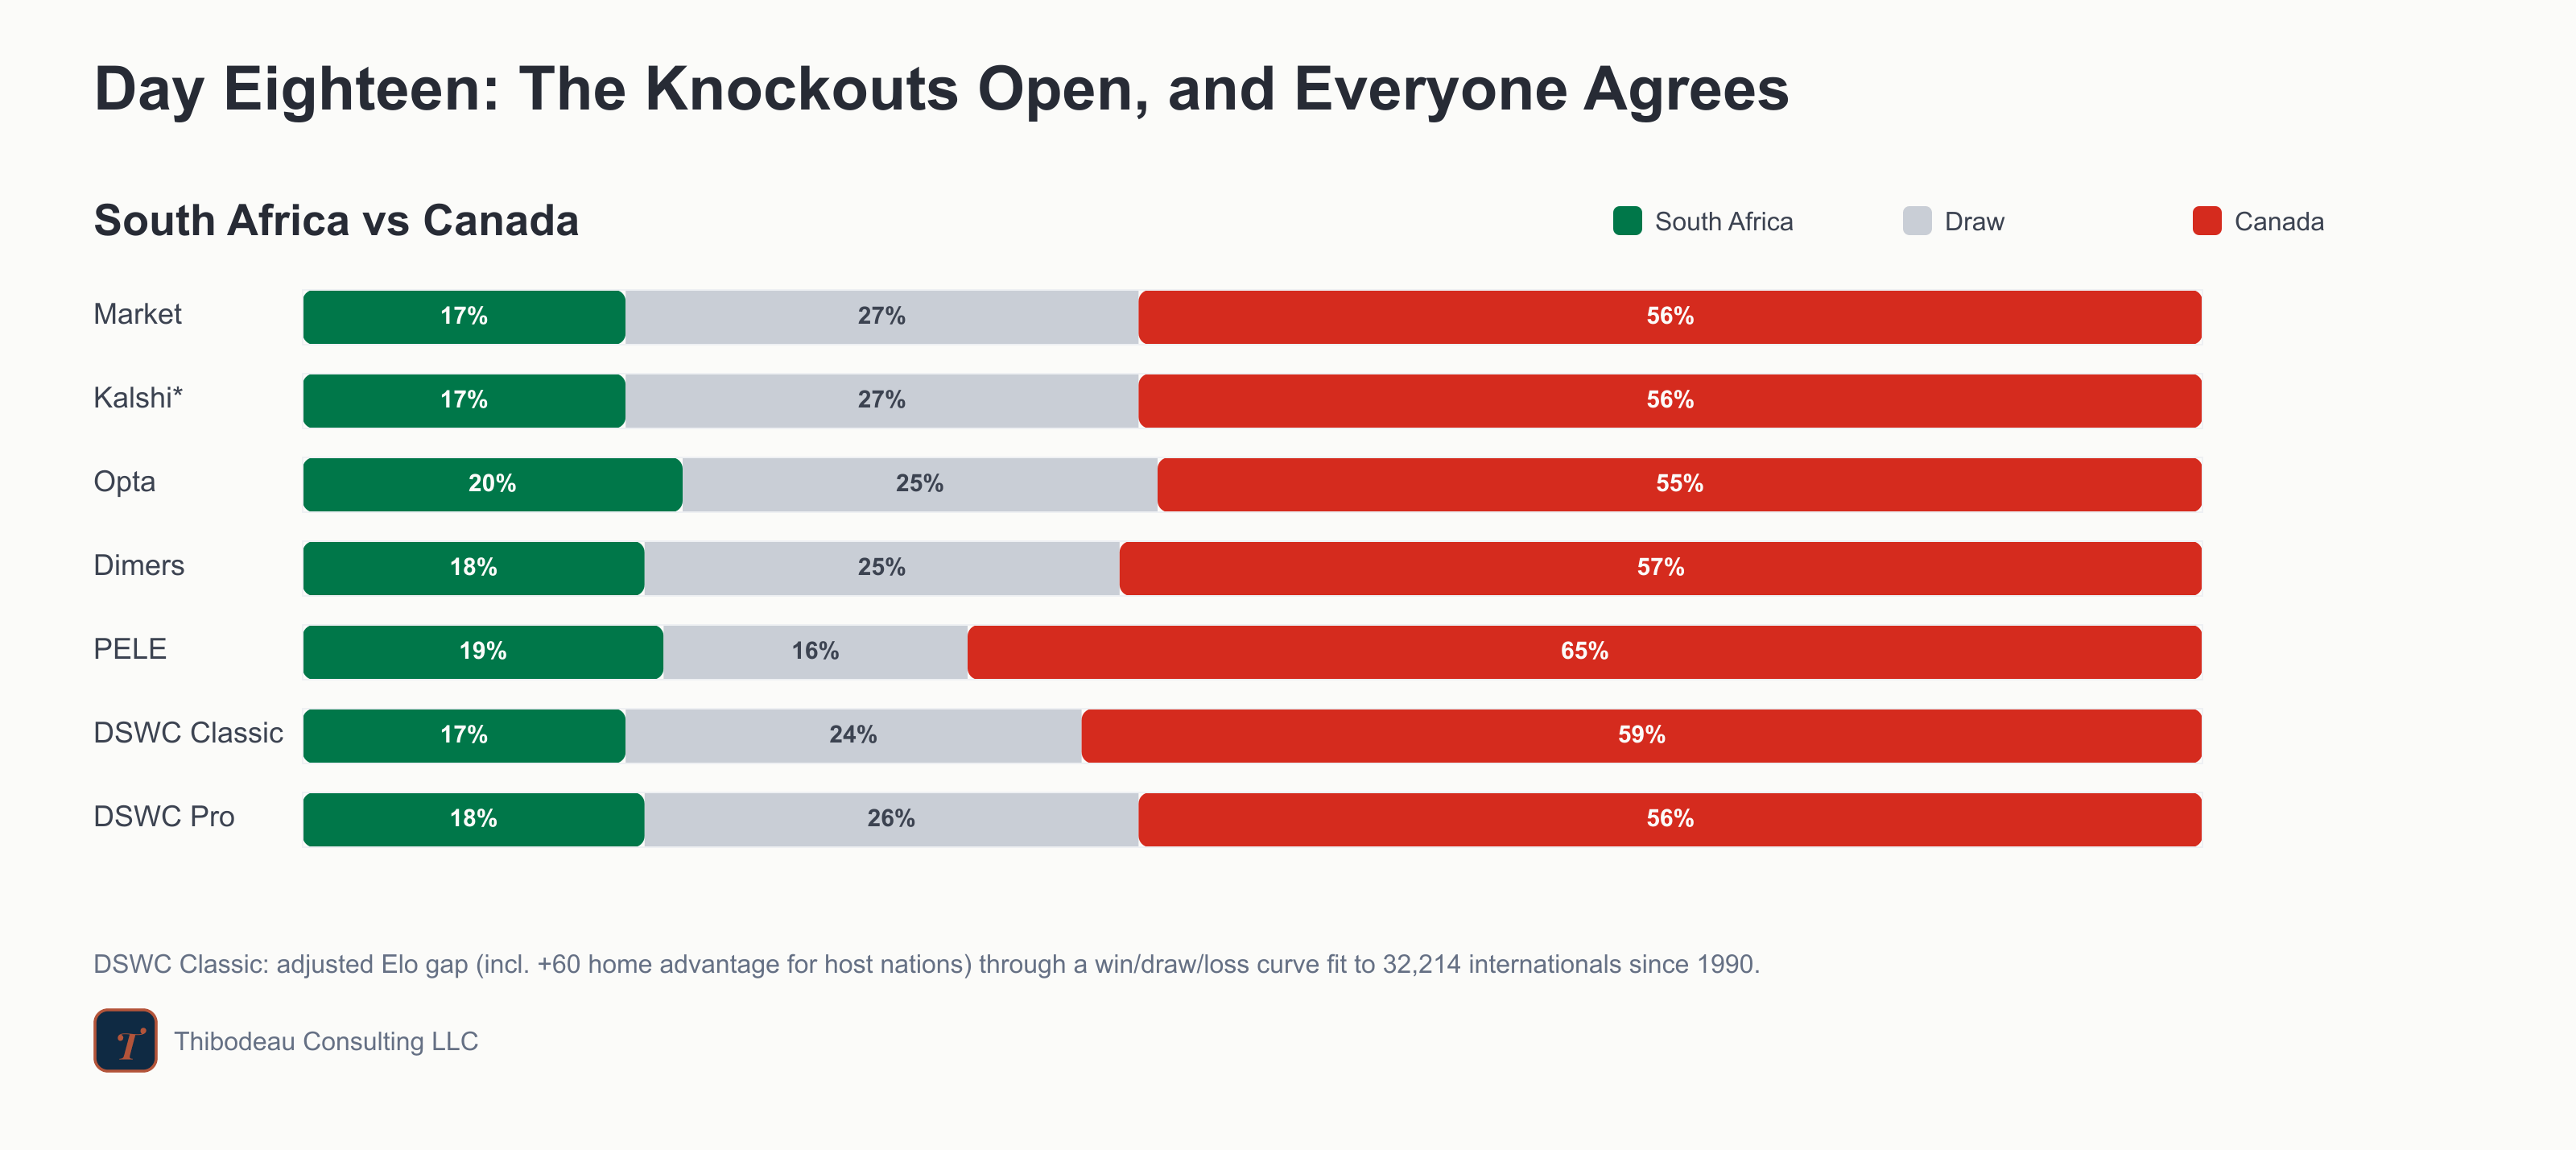
The knockouts open at SoFi Stadium with Canada against South Africa, two nations in the World Cup’s round of 32 for the first time in their histories [game_card]. And for once, everyone agrees. All seven of our forecasters make Canada the favorite: the market, Kalshi, Dimers and DSWC Pro clustered at 56 to 57 percent, Opta at 55, our Classic model a touch bolder at 59, and Nate Silver’s PELE boldest of all at 65. South Africa sits at 17 to 20 percent, the draw around a quarter, which in a knockout just means extra time and the lottery past it.
This has been great. I've enjoyed reading it while learning about data science and the world cup.
One suggestion: A few places like The Athletic and Nate Silver have their full projections for the rest of the tournament. Would you be able to show yours? I'm curious how your two models would rate champions odds and odds to get to semis, etc.
Thanks - Jeff