How Models Get Better After They’re Wrong
Using World Cup misses to separate noise from blind spots

Day seventeen, and we’re at the end of the sorting phase. By tonight, the last three groups will close, the third-place waiting room will empty, and the World Cup will trade arithmetic for knockout soccer.
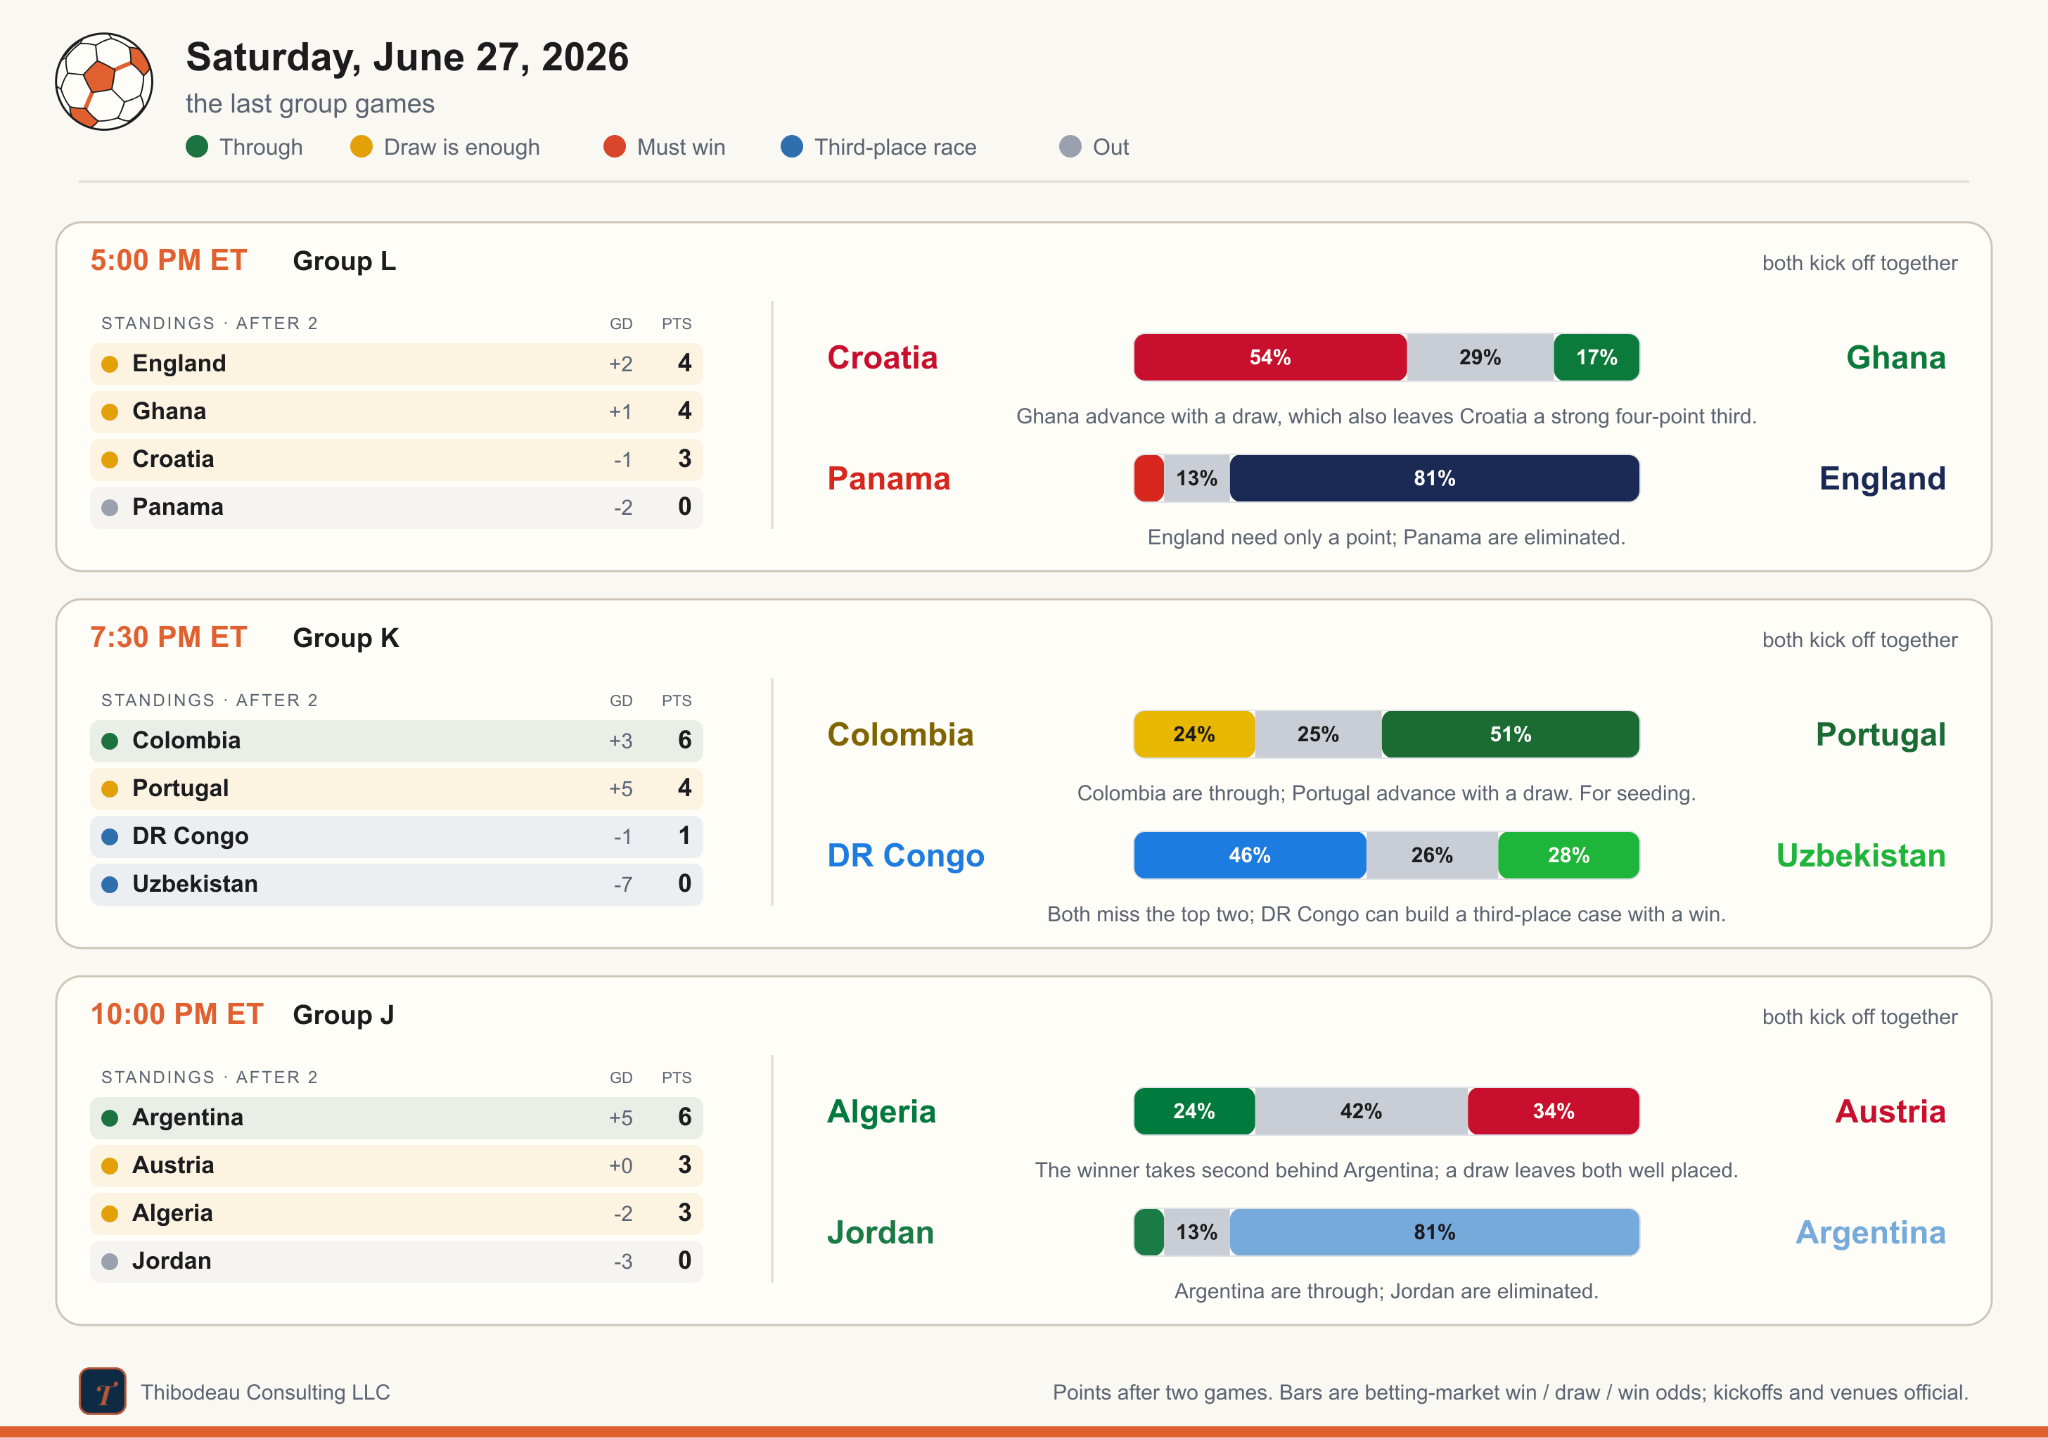
That does not mean the final day is clean though. In Group L, England are already safe but still have seeding to settle. Croatia and Ghana can both see the knockouts, but not from the same seat. In Group K, Colombia and Portugal are through and playing for position, while DR Congo and Uzbekistan are left trying to turn third place into a lifeline. In the late slate for Group J, Argentina are safe, Jordan are out, and Algeria-Austria is a match for second place, with the loser hoping four points are enough. But first, a quick recap.
Previously, at the World Cup
Yesterday mostly did what the table said it would, but it still changed the shape of the bracket. France beat Norway 4-1 to win Group I cleanly, while Senegal did everything a third-place team can do for itself, crushing Iraq 5-0 to finish on three points with a plus-two goal difference.
Group H was quieter but stranger. Spain beat Uruguay 1-0 and won the group, while Cape Verde’s 0-0 draw with Saudi Arabia was enough to send it through in second. Uruguay, with two points, slid into the third-place waiting room; Saudi Arabia went out.
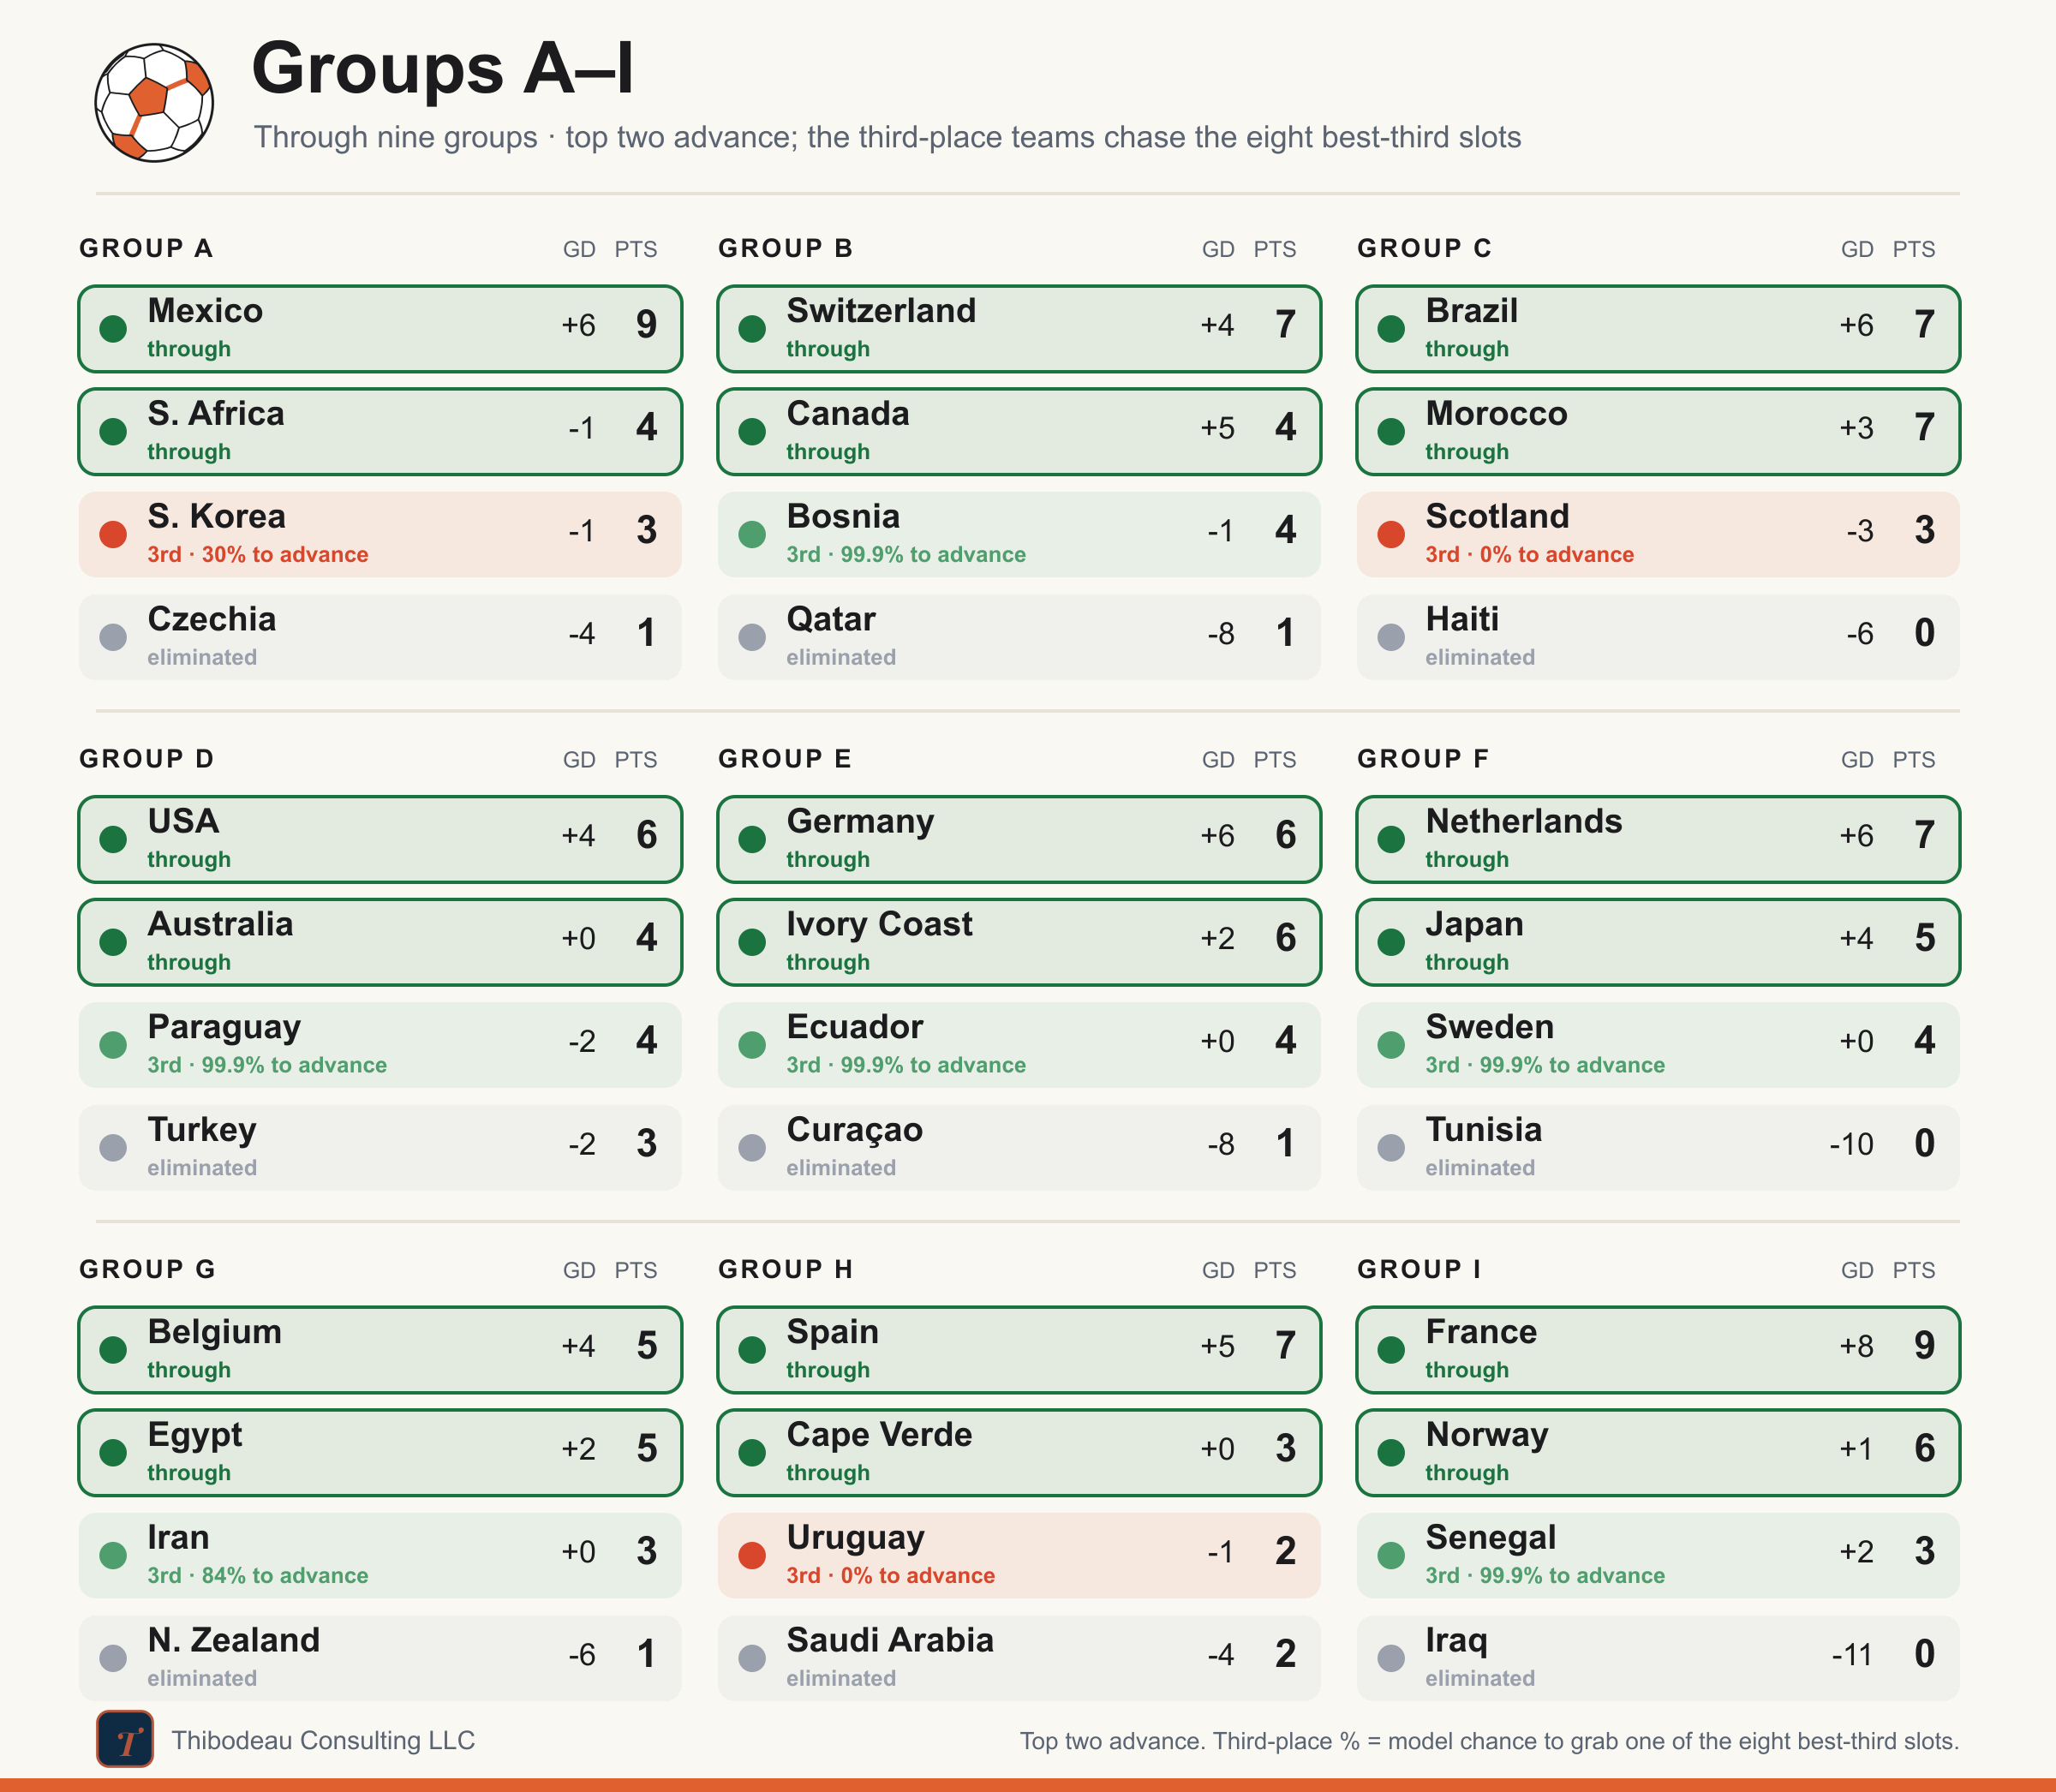
Then Belgium made the night’s loudest move, beating New Zealand 5-1 to jump over Egypt and win Group G. Egypt’s 1-1 draw with Iran was enough for second, and Iran was left as another three-point third-place team hoping the rest of the board breaks kindly. The card below shows how things stand for the groups that have finished their games.
Question 17: What kind of wrong were the models?
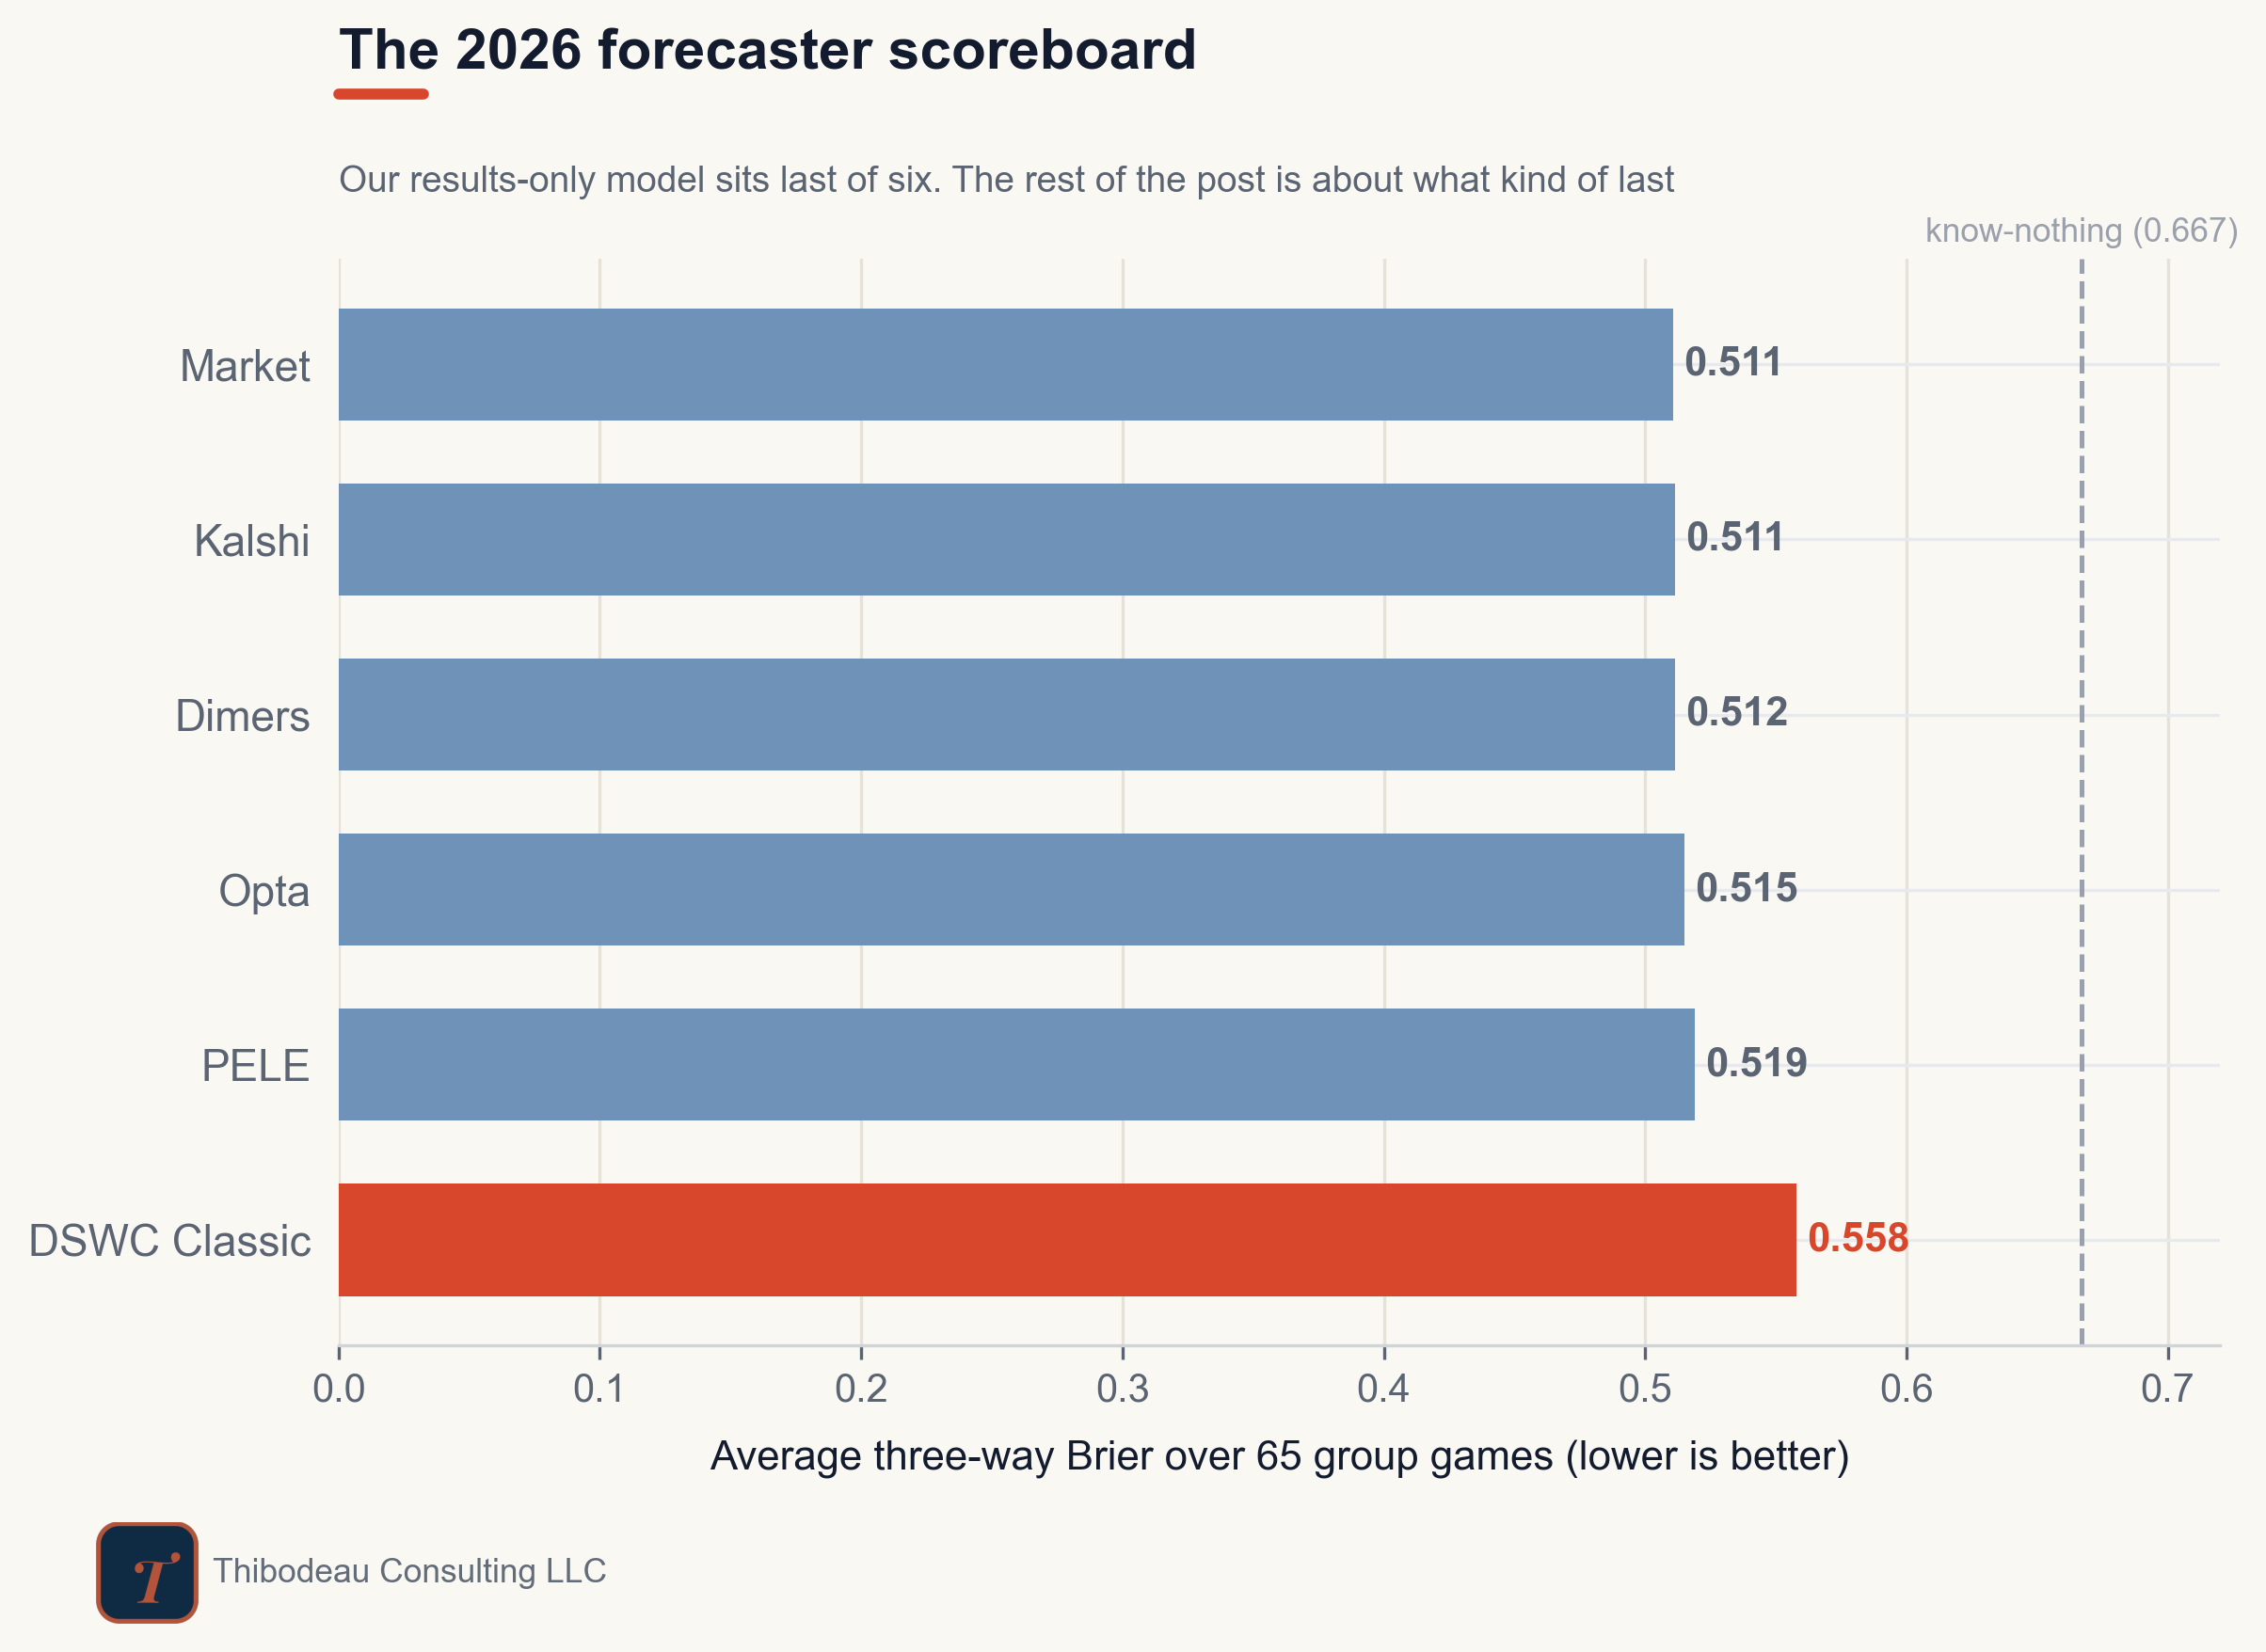
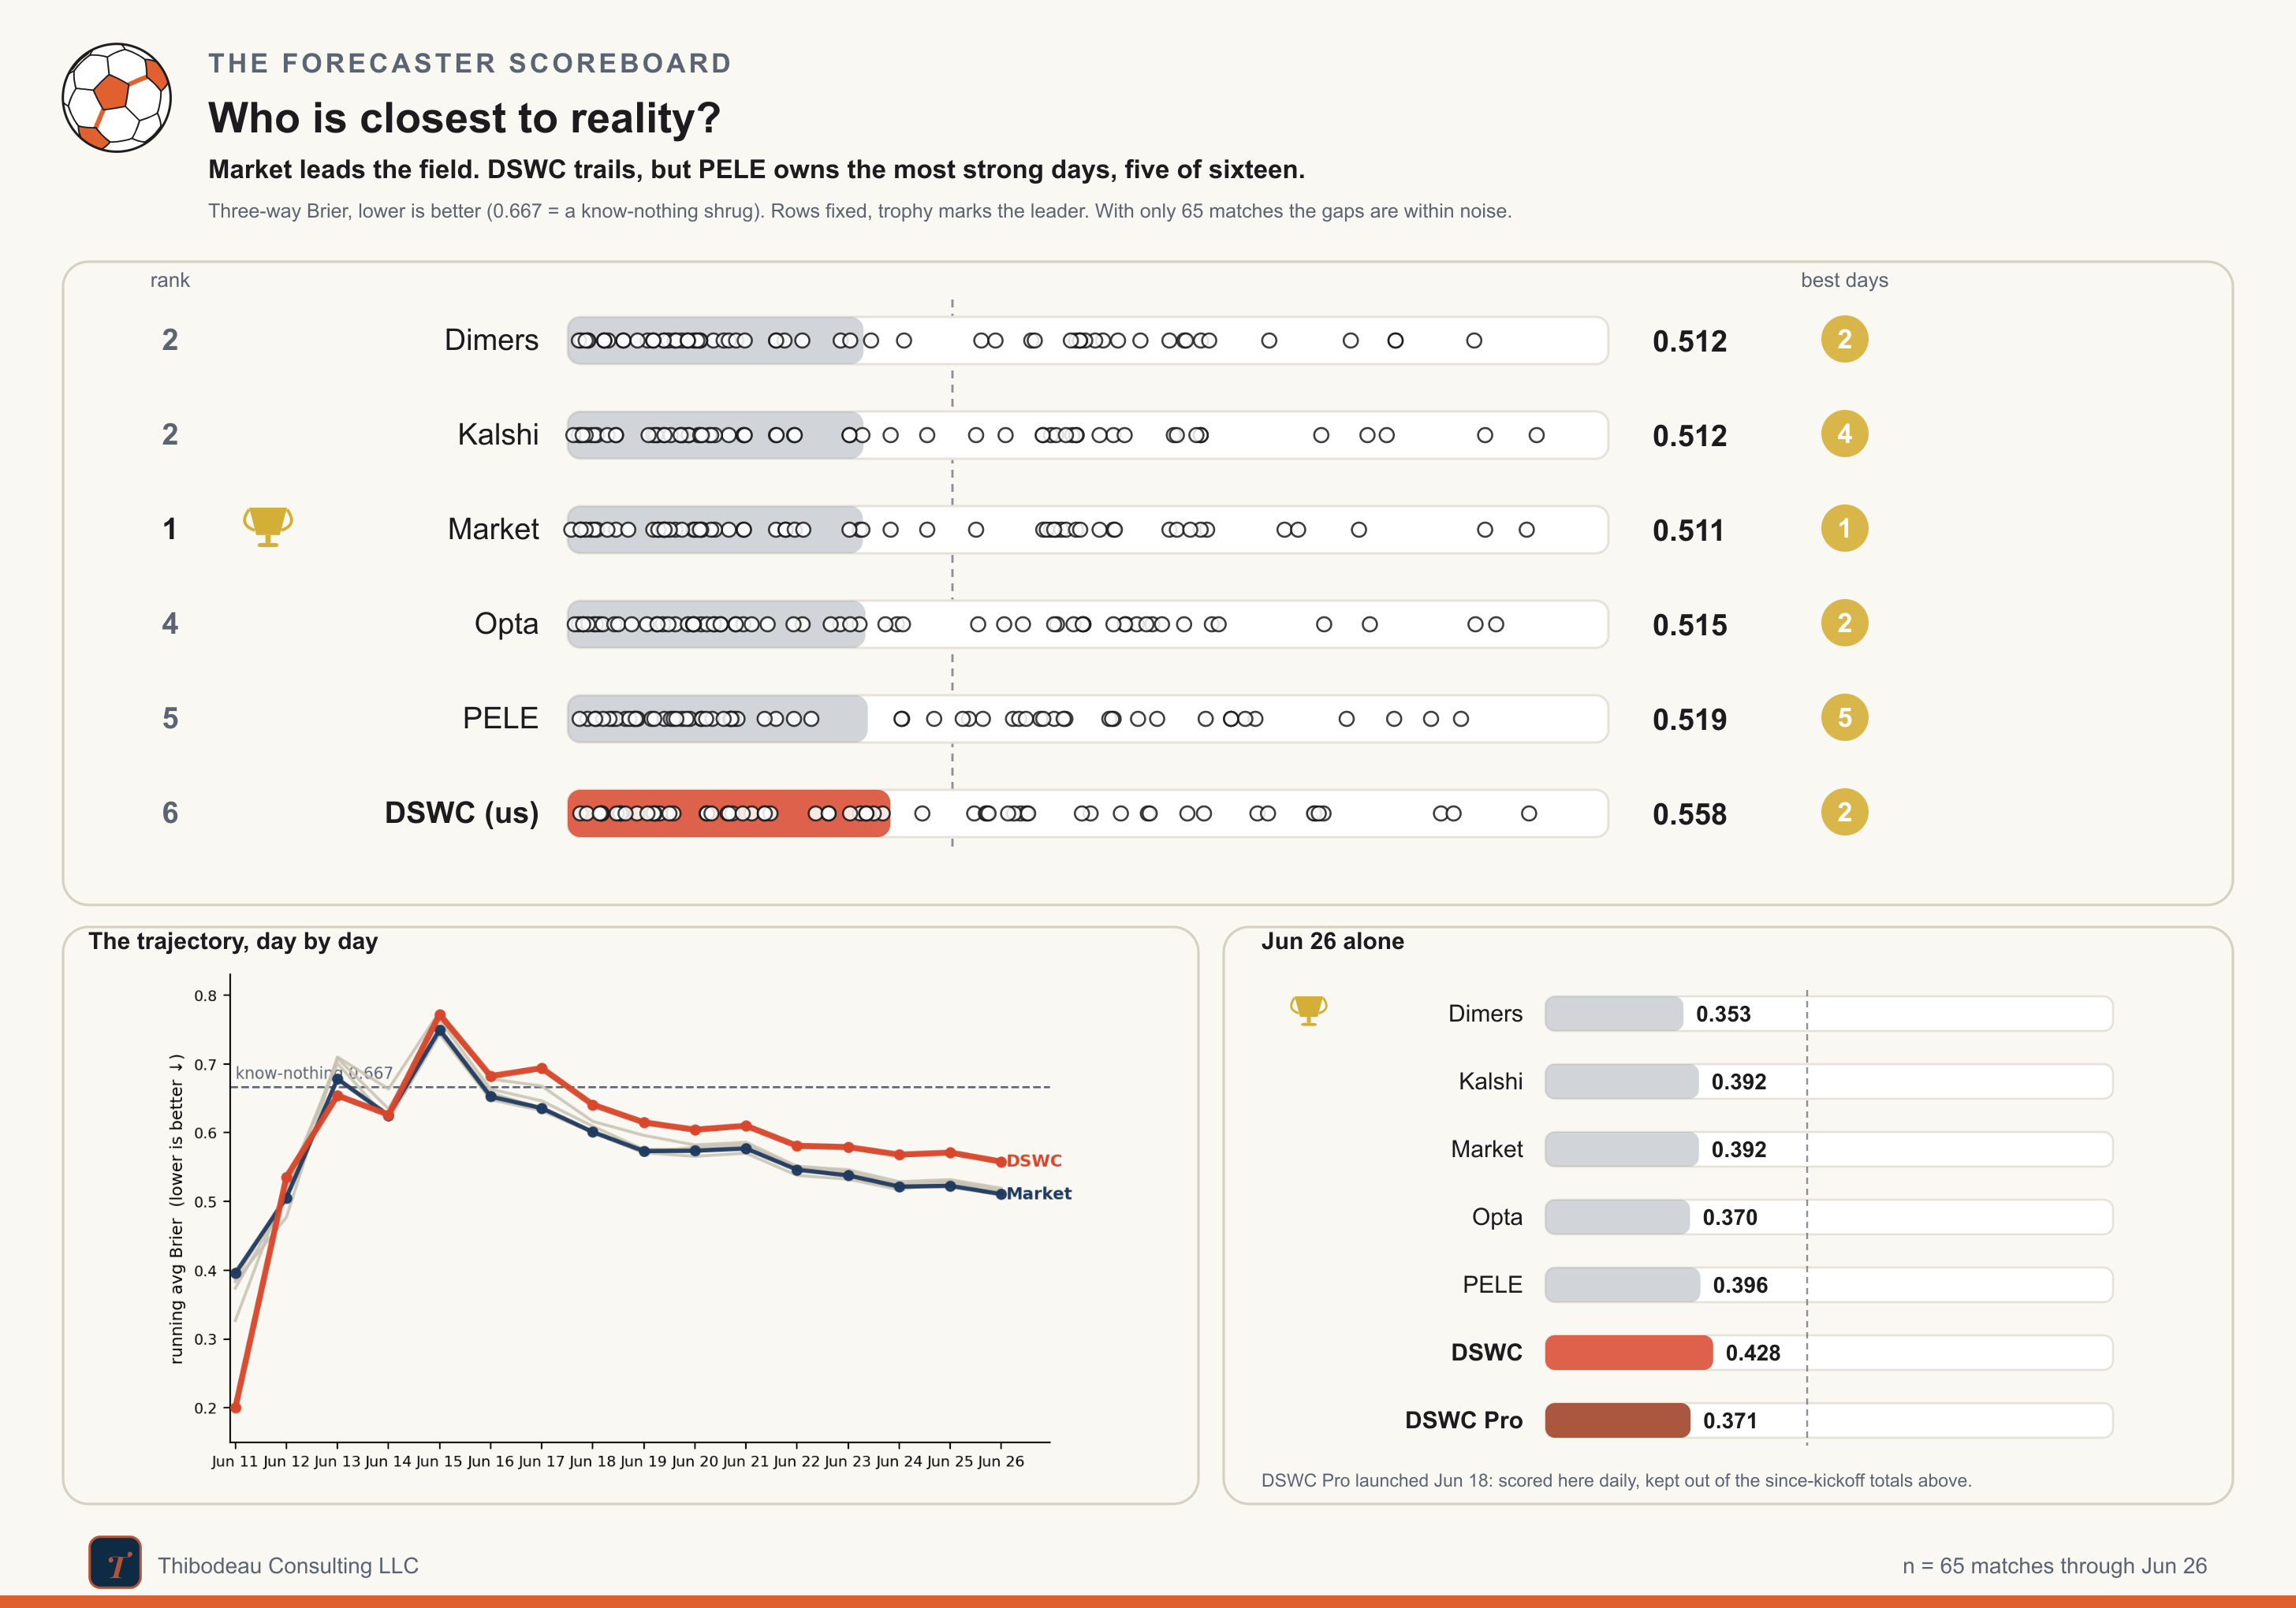
A scoreboard tells you who is winning. Error analysis tells you why. Through sixteen days and sixty-five group-stage matches, the scoreboard is tight at the top and not kind to us. The market leads at 0.511. Kalshi is essentially tied. Dimers, Opta, and PELE sit just behind. DSWC Classic, our results-only model, trails at 0.558.
That tells us Classic has been worse. It does not tell us what kind of worse. So let’s cut the errors open systematically.
Error analysis: The method
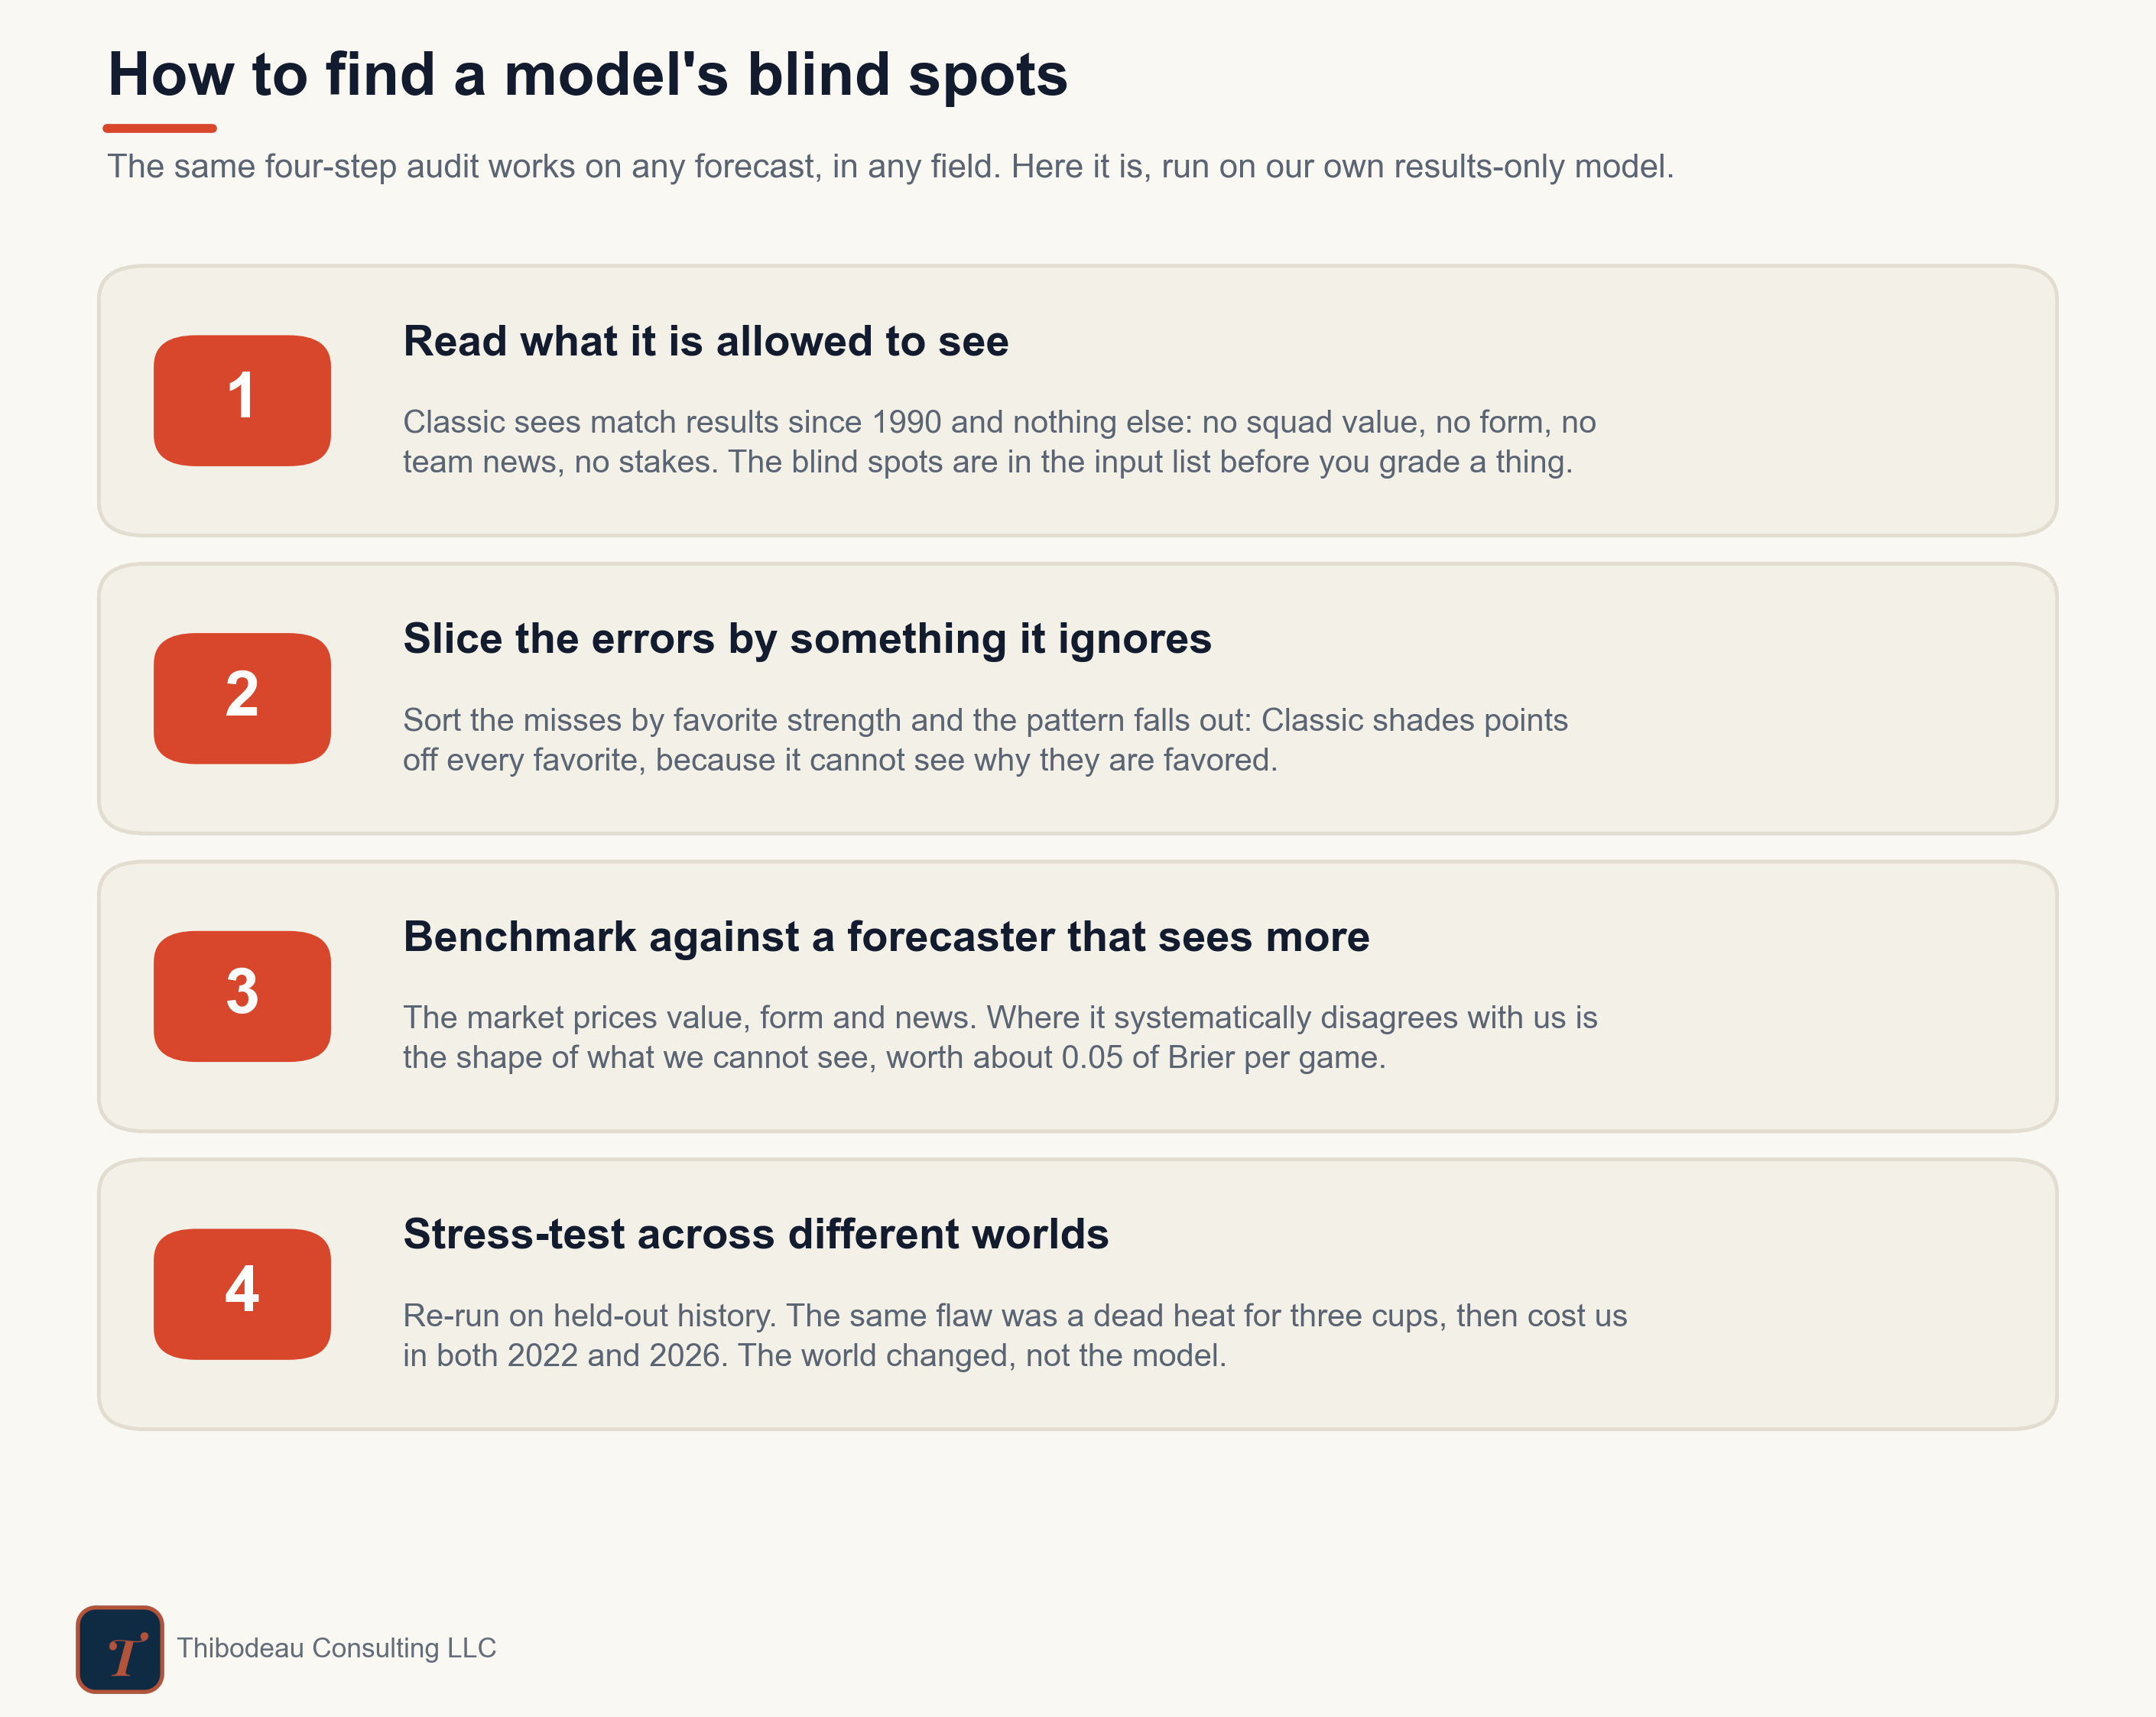
First, look at the world from the model’s point of view. What information is it allowed to see? What is invisible by design? In our case, Classic sees match results and Elo gaps. It does not see squad value, form, lineups, incentives, or table state.
Then slice the errors by the things it ignores. If the misses are random, there may not be much to learn. But if they cluster around a missing variable, you have found a blind spot.
Next, compare it with a forecaster that sees more. The market is useful here because it absorbs price, form, news, injuries, and incentives. Where the market consistently disagrees with Classic, we get a map of Classic’ cannot see.
Finally, stress-test the pattern across other tournaments. A blind spot that appears once might be noise. A blind spot that survives different World Cups is a structural flaw.
That is the four-step audit: read the inputs, slice the errors, benchmark against a richer forecast, and test whether the pattern survives in other worlds.
The biggest error is a decoy
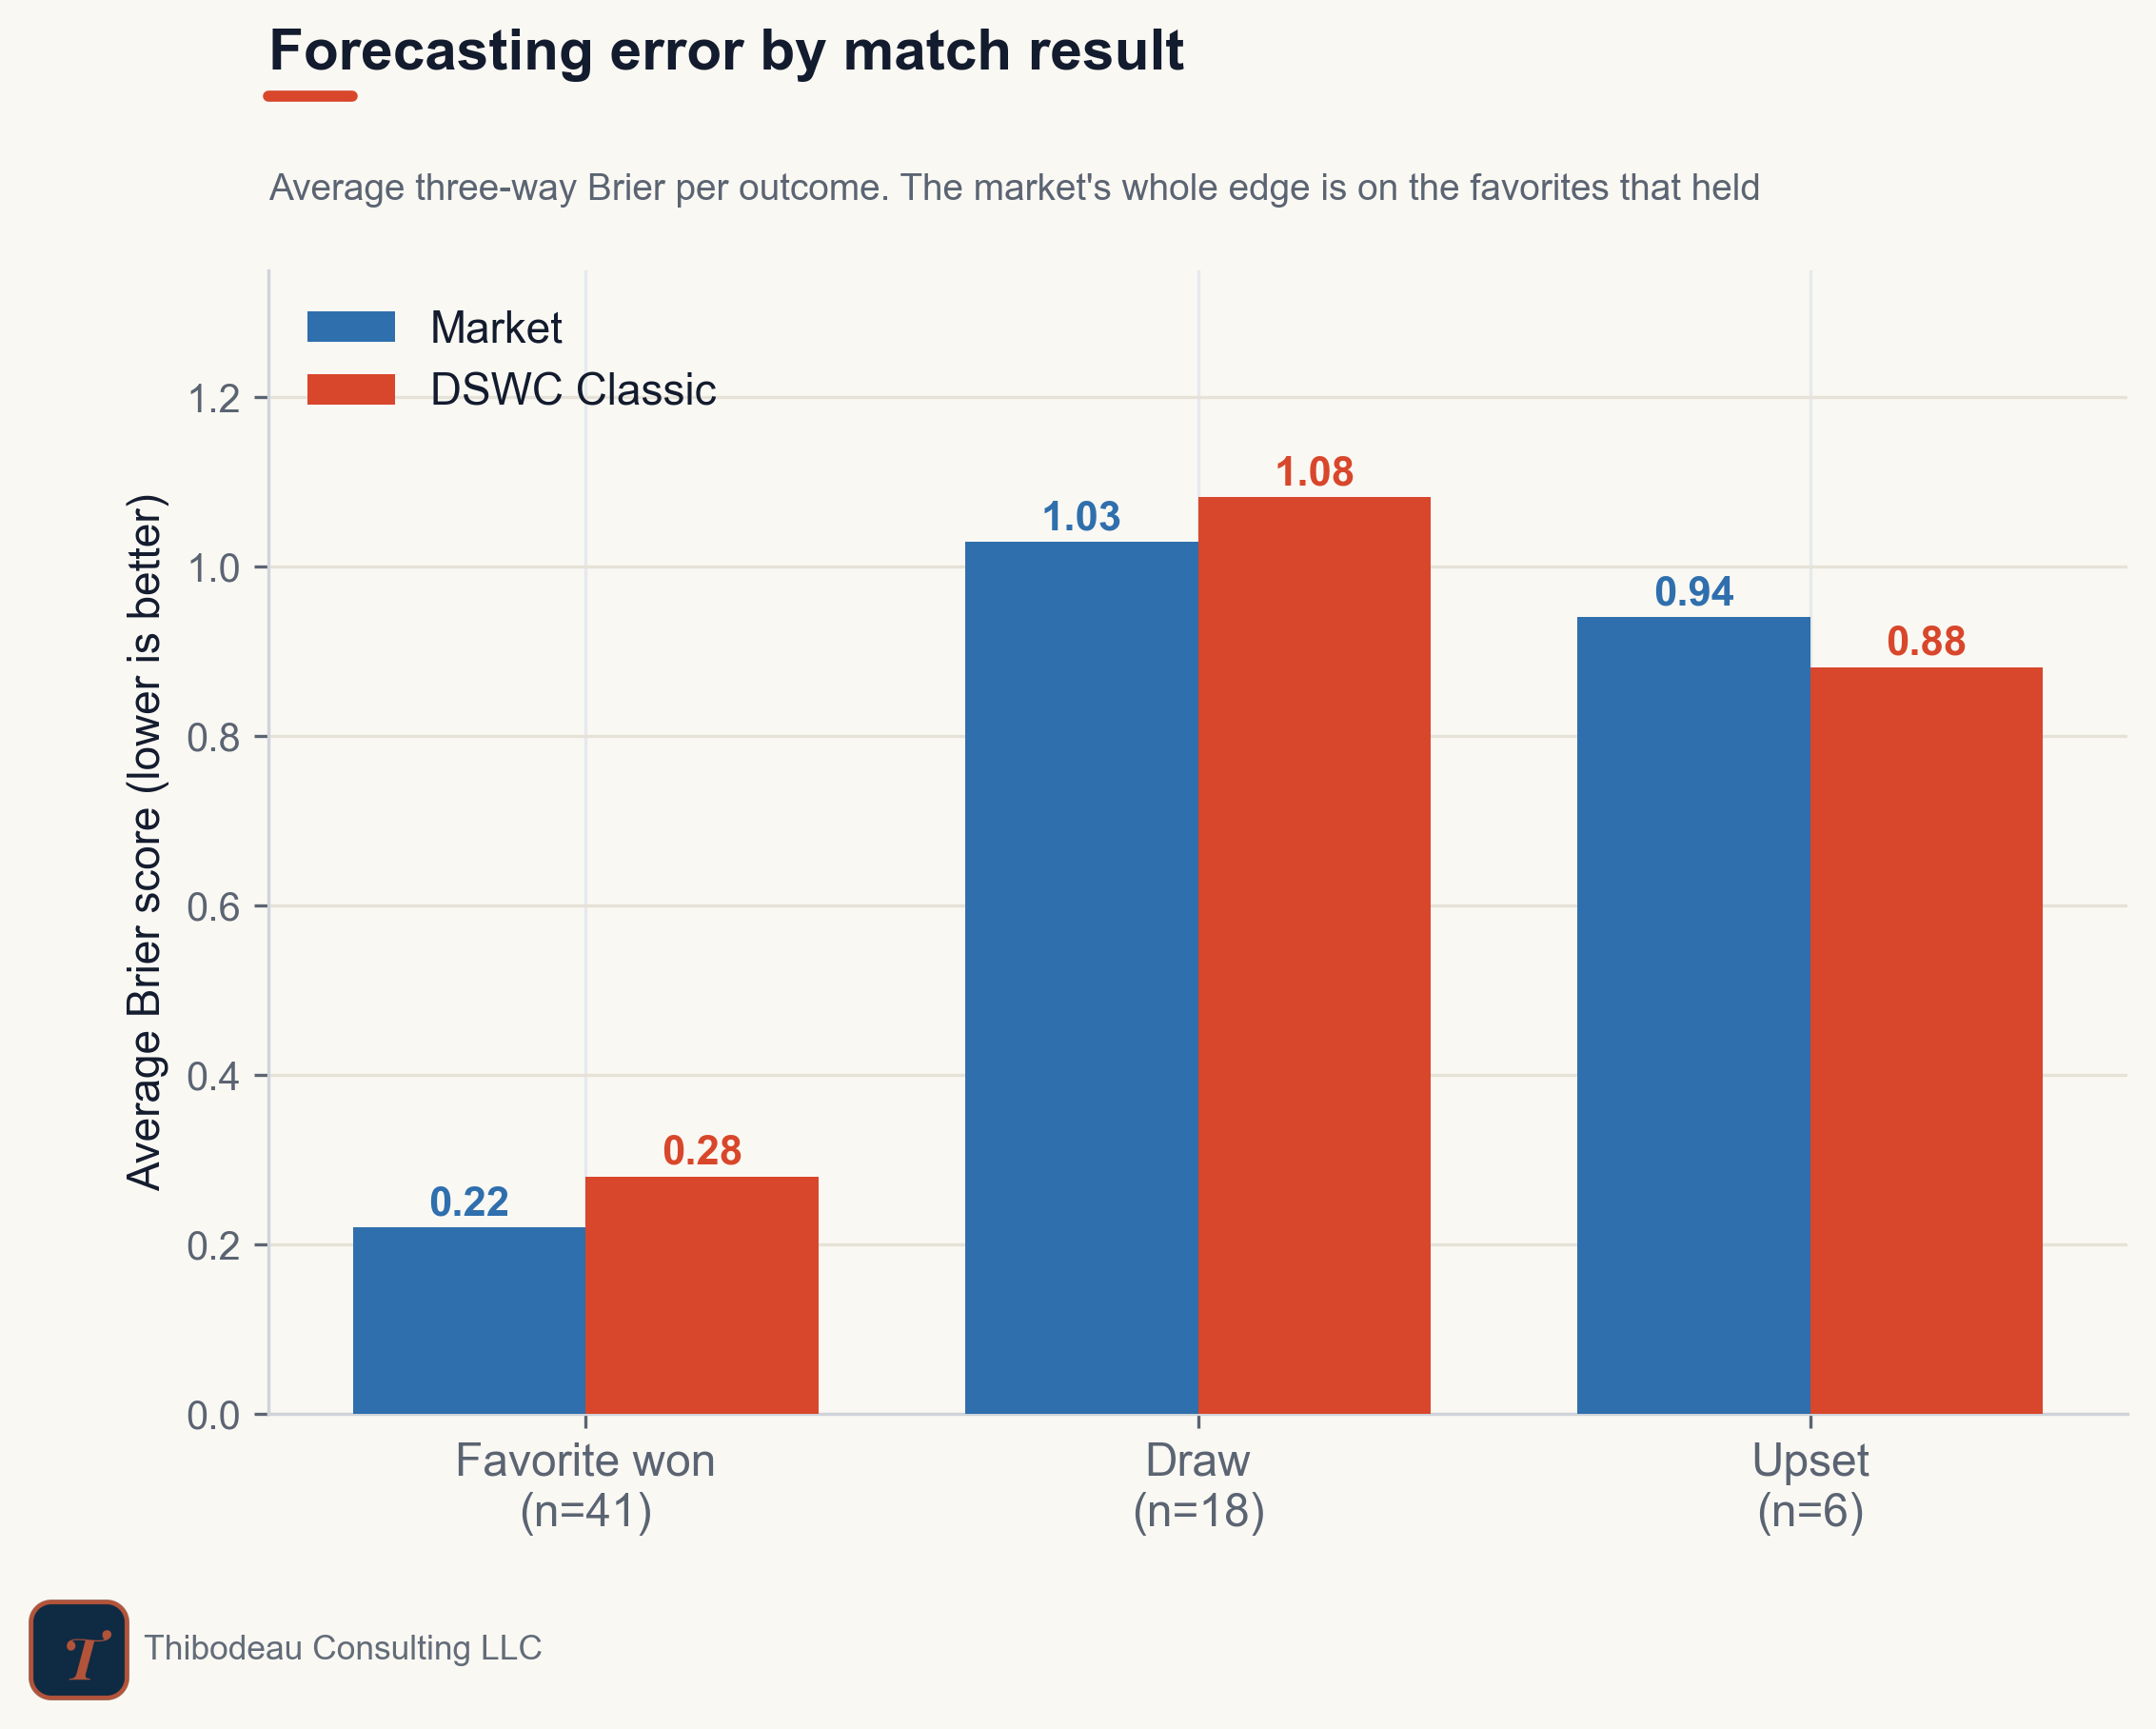
So let’s start with the obvious slice: match results. And let’s zoom in on draws. That gives us the tallest bar on the chart. Our average Brier error was 1.08 for games that ended in a draw, 0.88 for games where the favorite lost (upsets) and 0.28 where the favorite won.
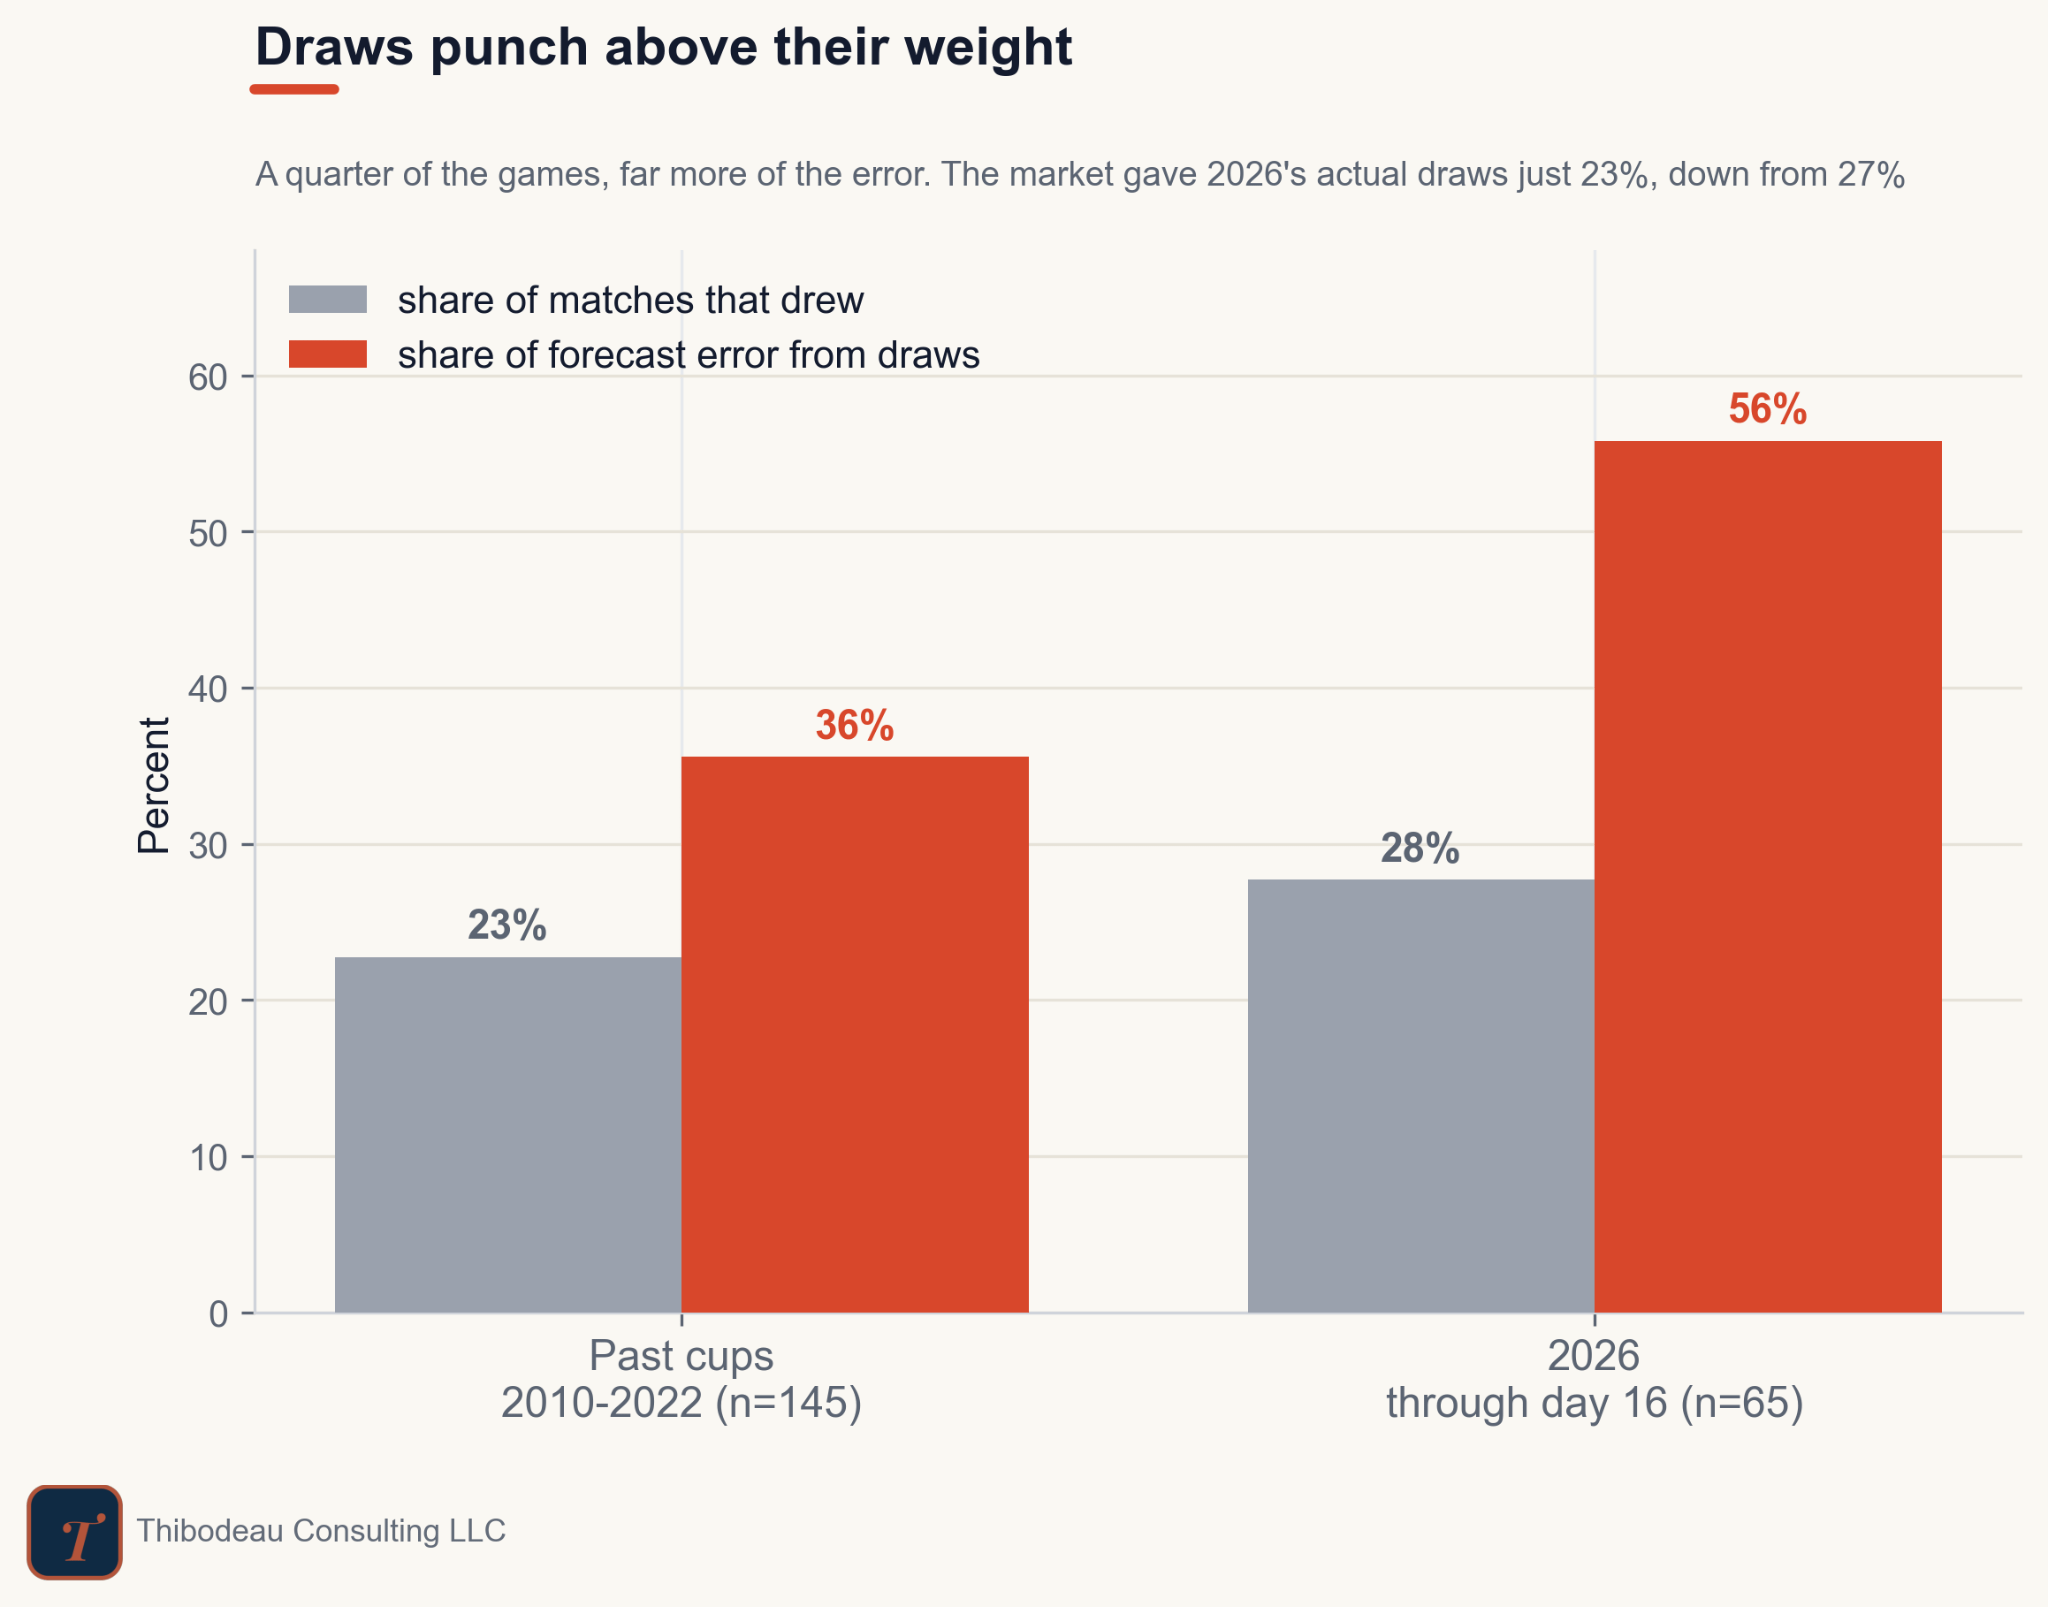
The bar for draws is the highest because draws were more frequent this year than they have been in the past. Roughly 28 percent of the games have ended in a tie this year compared to the average from 1998 through 2022, which is 23%. The easy conclusion is that Classic has a draw problem.
But this is where step three matters: compare it with a forecaster that sees more.
The market took the same hit. On average, the market’s Brier was 1.03 for games that ended in a draw, 0.94 for upsets, and 0.22 when favorites won. Draws punished everyone. That makes them a tournament problem, not specifically a Classic problem.
This is a useful warning. The biggest bar on an error chart often tells you which games were hard, not which model was weak. If you chase that bar blindly, you can sometimes end up fixing the wrong thing.
Our model’s real weakness shows up in the next slice.
Classic would not commit
Now slice the errors by favorite strength. This is where the model’s signature appears. Classic consistently gave favorites less credit than the market did. On average, it put the favorite about two points lower. On clear favorites, the gap was bigger: the market averaged 76 percent; Classic averaged 71. That sounds small, but it adds up.
The technical name for the missing ingredient is resolution. Resolution is a forecaster’s ability to separate the slate: to know which games are nearly safe and which are genuinely dangerous. A model can be calibrated on average and still have poor resolution if it nudges everything toward the middle.
Why that hurt this year
The model’s caution helped on the rare shock. Classic looked good when Australia beat Turkey. It looked useful when Belgium and Iran drew. Leaving extra probability on the longshot pays when the longshot actually lands.
But favorites won more often this year than they have in the past.
So the same caution that helped on a few upsets quietly taxed Classic over and over again when favorites held. Norway over Iraq. Scotland over Haiti. France, Belgium, Spain. The market knew which favorites were safer than their bare results history suggested.
That is where the gap came from. Classic was a little too timid in too many games where the favorite simply did what they were supposed to do.
Not just a 2026 problem
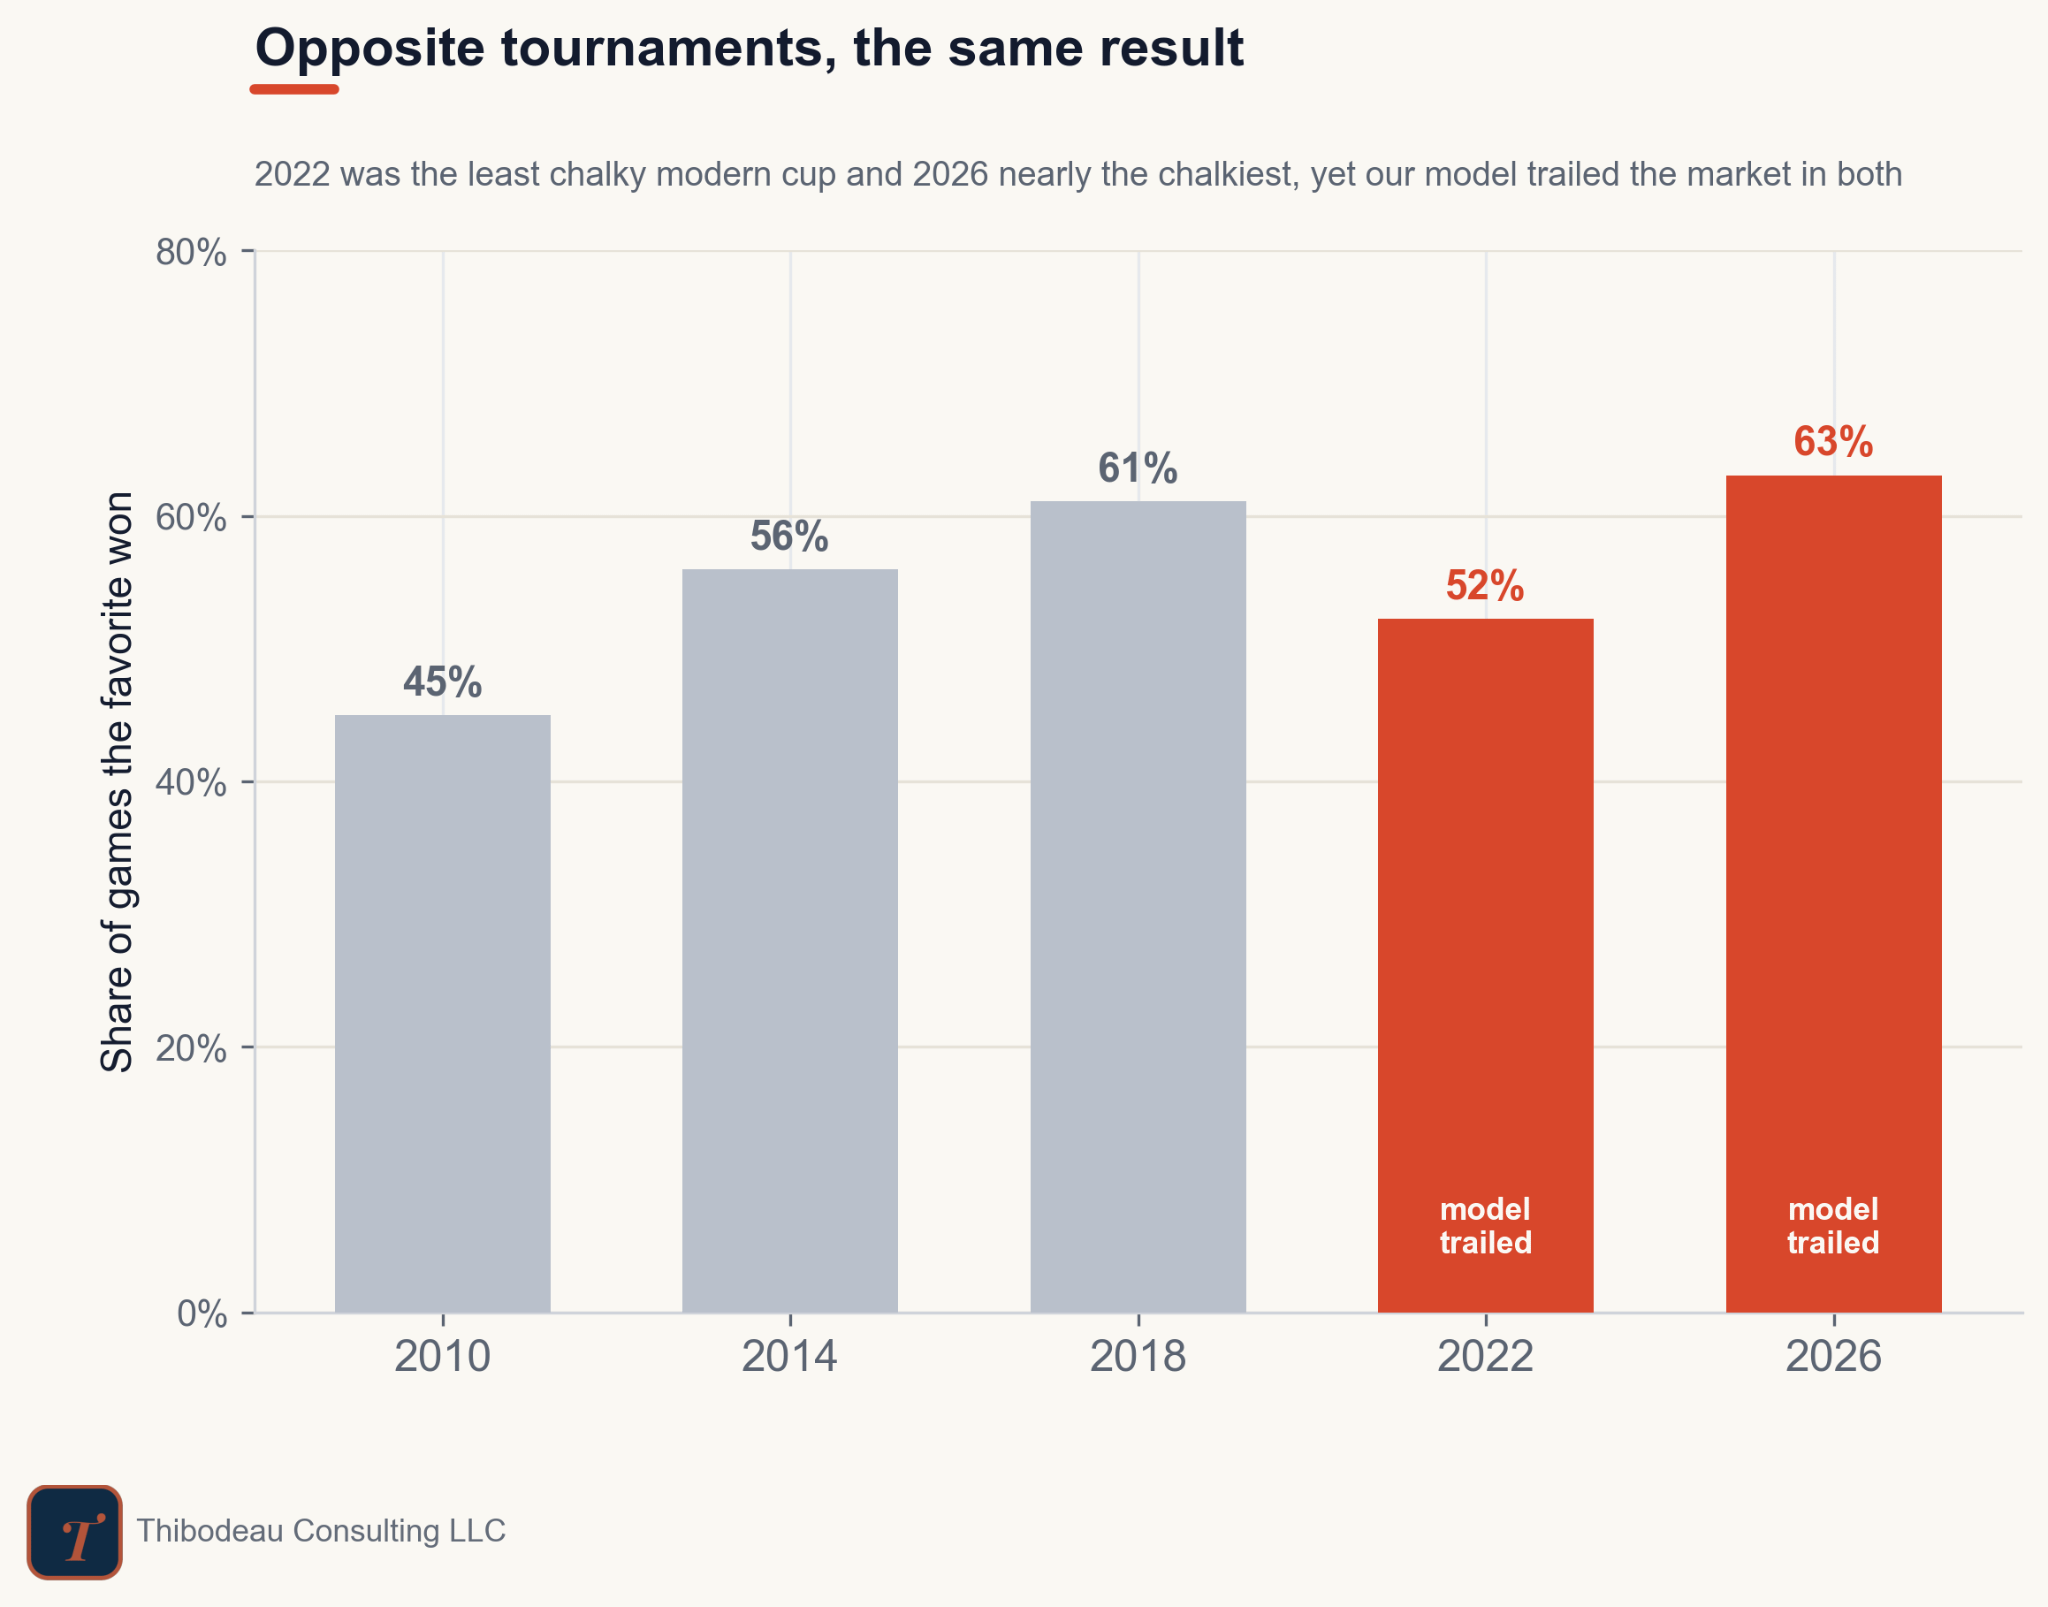
The last step is the stress test. Maybe this was just a 2026 quirk or maybe it is more fundamental. The plot below shows how the model did versus the market in past World Cup group stages.
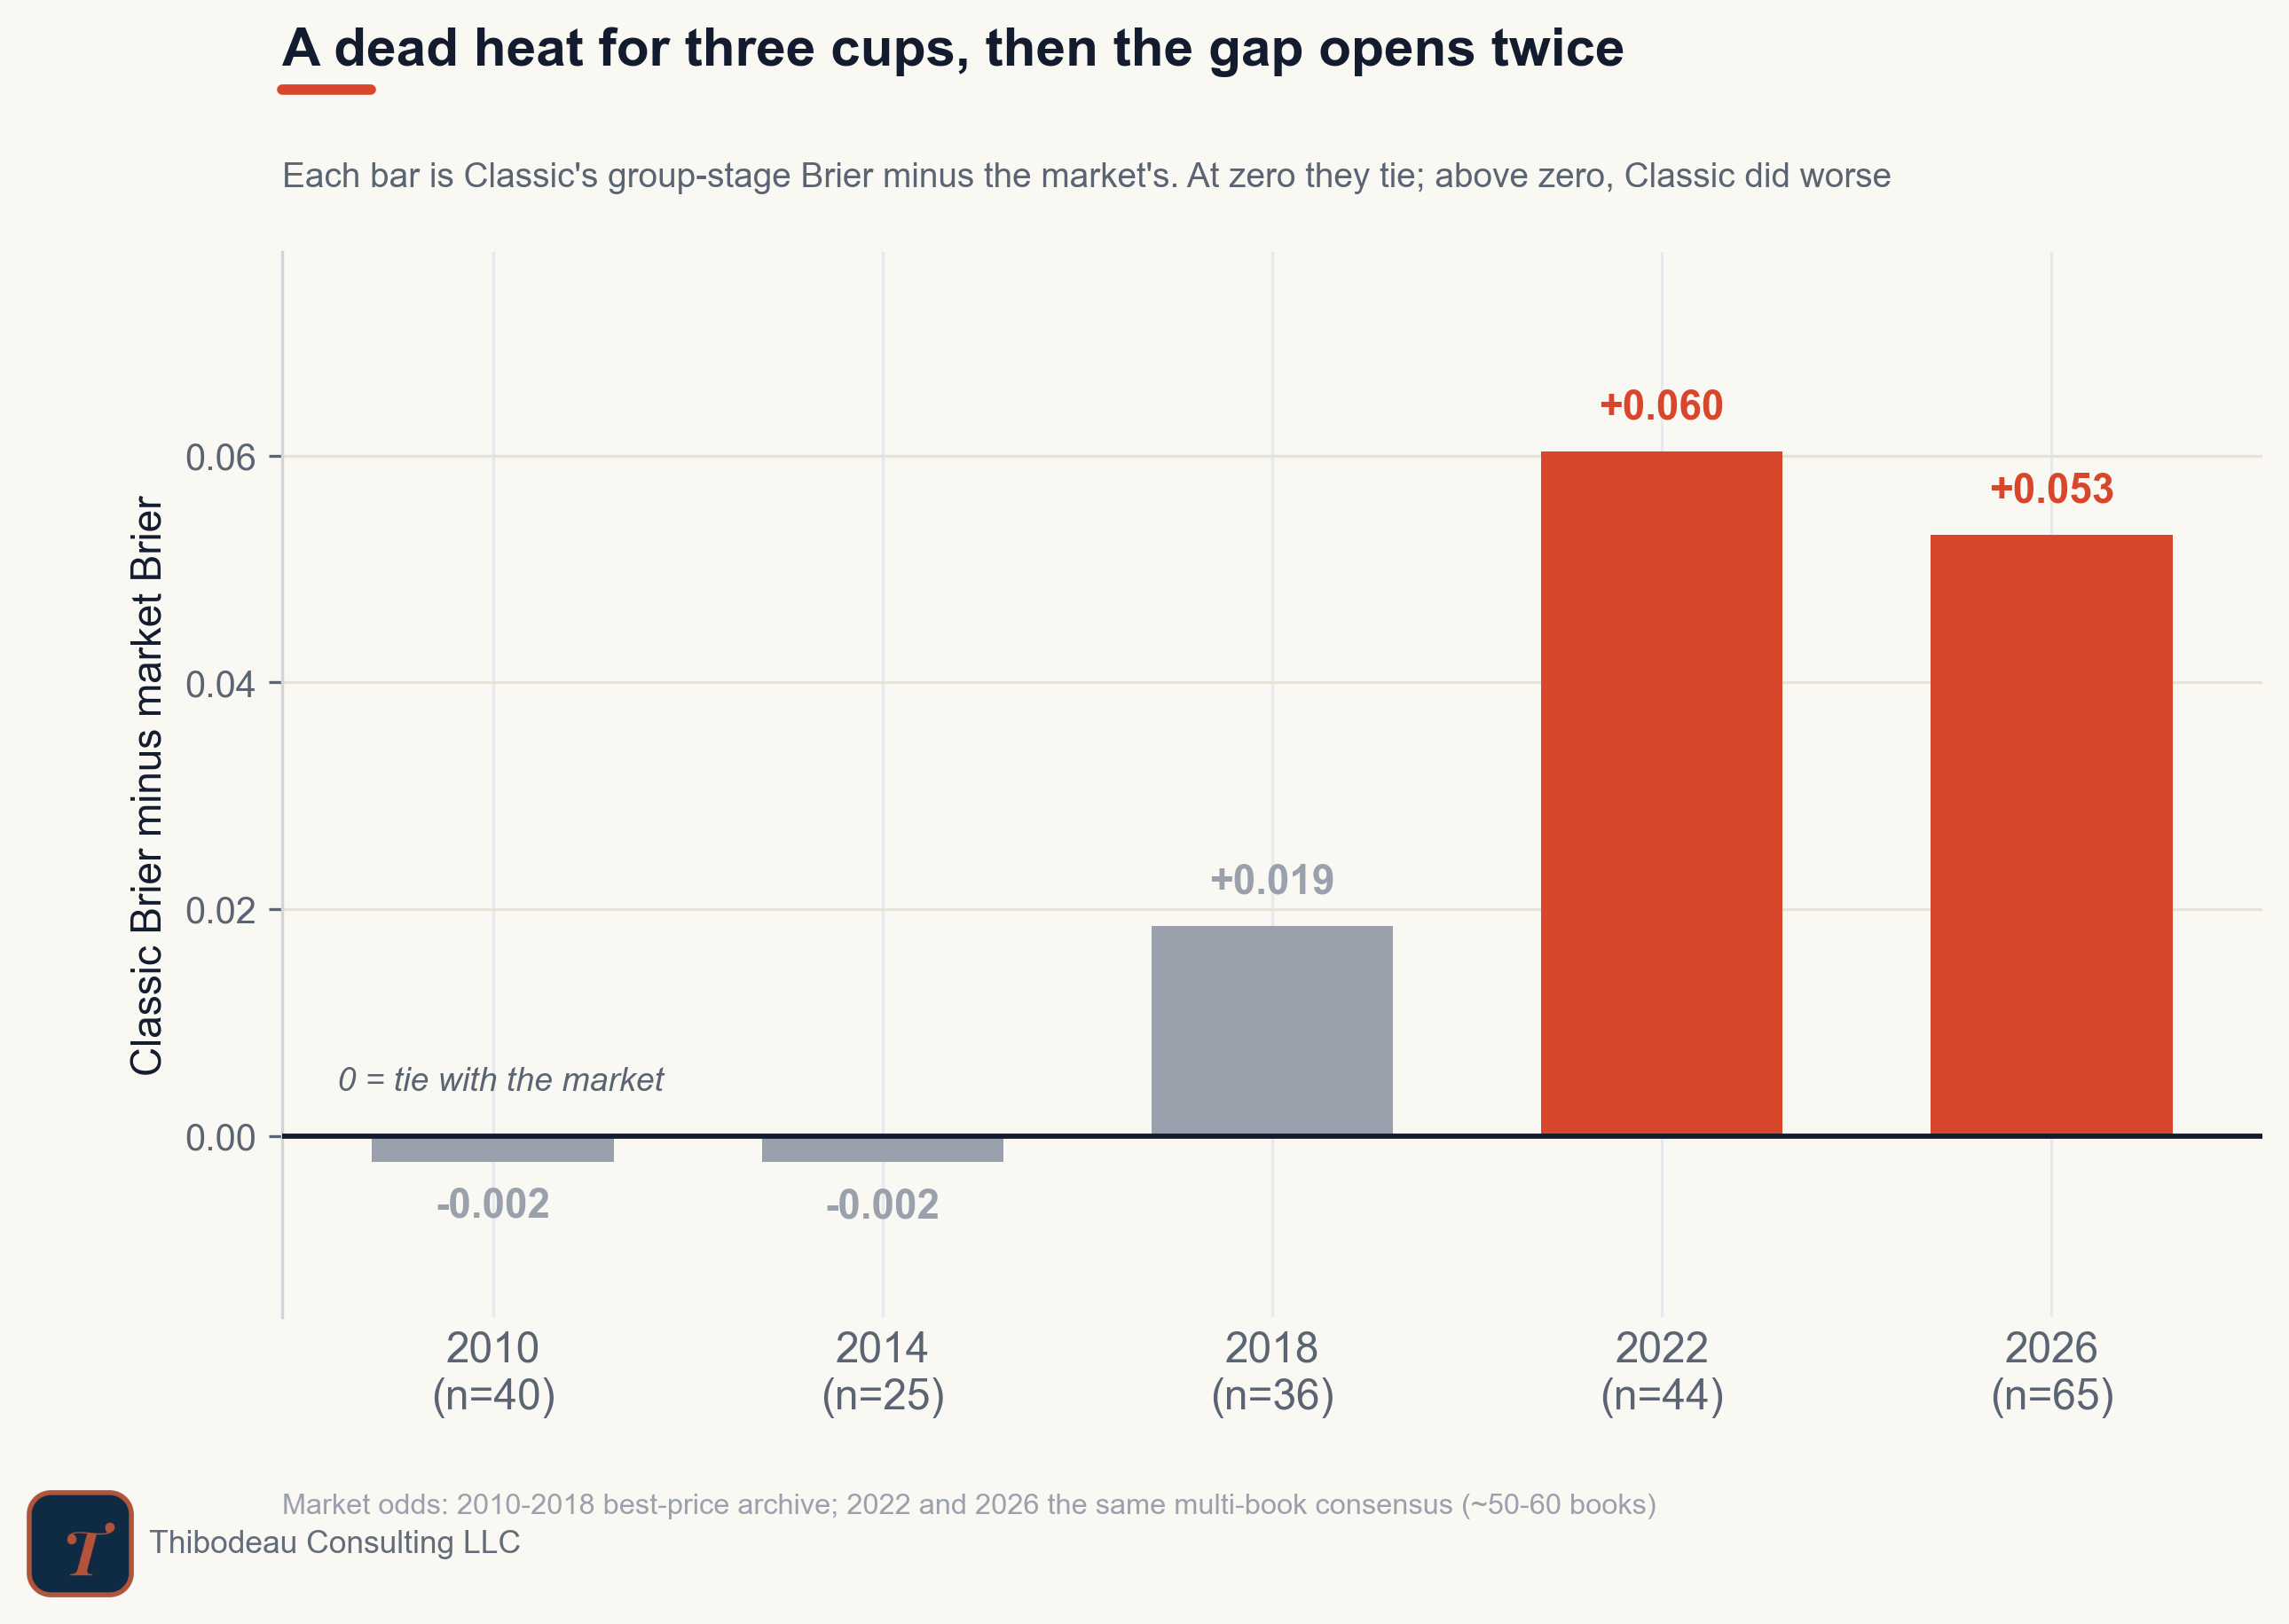
For a while, it held up. In 2010 and 2014, Classic basically matched or beat the market. In 2018, it trailed by almost nothing. Then the gap opened. In both 2022 and 2026, Classic finished about five to six hundredths of Brier behind the market. That is the important part: this is not only a 2026 story.
What’s interesting is that the 2022 and 2026 tournaments could not have looked more different. In 2026, favorites mostly won. In 2022, was more upset heavy: Saudi Arabia beat Argentina, Japan beat Germany and Spain, and favorites won barely half the time. Same failure, different costume.
The underlying issue was not separating the slate well enough. The market’s information about the broader game state boosted confidence on the favorites that were genuinely safe and trimmed it on the ones that only looked safe on paper. Classic, with nothing but the results ledger to go on, could not tell those two apart, so it hedged both toward the middle. In a year favorites ran the table, that timidity got charged again and again; in a year they fell, it would have cost less. The costume changed. The flaw did not.
A Limitation, Not a Bug
None of this means the model is broken. Classic was built to see match results and Elo gaps and nothing else, on purpose. A forecast that ignores squad value, form, lineups, and stakes is going to under-rate the favorites those things explain. That is not an error we overlooked. It is the price of a clean, reproducible baseline that never peeks at the news, and for sixteen days the audit has done its one job: it told us exactly what that price is.
That is why you pull errors apart instead of staring at the final score. The scoreboard said we were behind. The audit said why, where, and how much, and it pointed at a limitation we chose rather than one we missed. So the next time you watch a model lose, do not ask whether it is good or bad. Ask what it was never allowed to see.
Up Next
Tomorrow the tournament changes shape. The group stage is done, the waiting room is closed, and the round of 32 is finally set. We’ll wrap up what the new format gave us and then start making knockout-round predictions.
Today’s Scorecard and Forecasts
Day sixteen steadied the board after the previous day’s shakeup. Dimers had its bounce-back day, posting the best slate at 0.353, with Opta and DSWC Pro right behind at 0.370 and 0.371. The market and Kalshi were fine at 0.392, PELE was close behind, and Classic trailed the slate at 0.428.
The overall race is now extremely tight at the top. Through 65 matches, the market leads at 0.511, with Kalshi and Dimers both at 0.512. Opta sits just behind at 0.515, then PELE at 0.519. Classic remains sixth at 0.558. Lower is better, and with the top five packed this closely, the group-stage title is still within one strange day of changing hands.
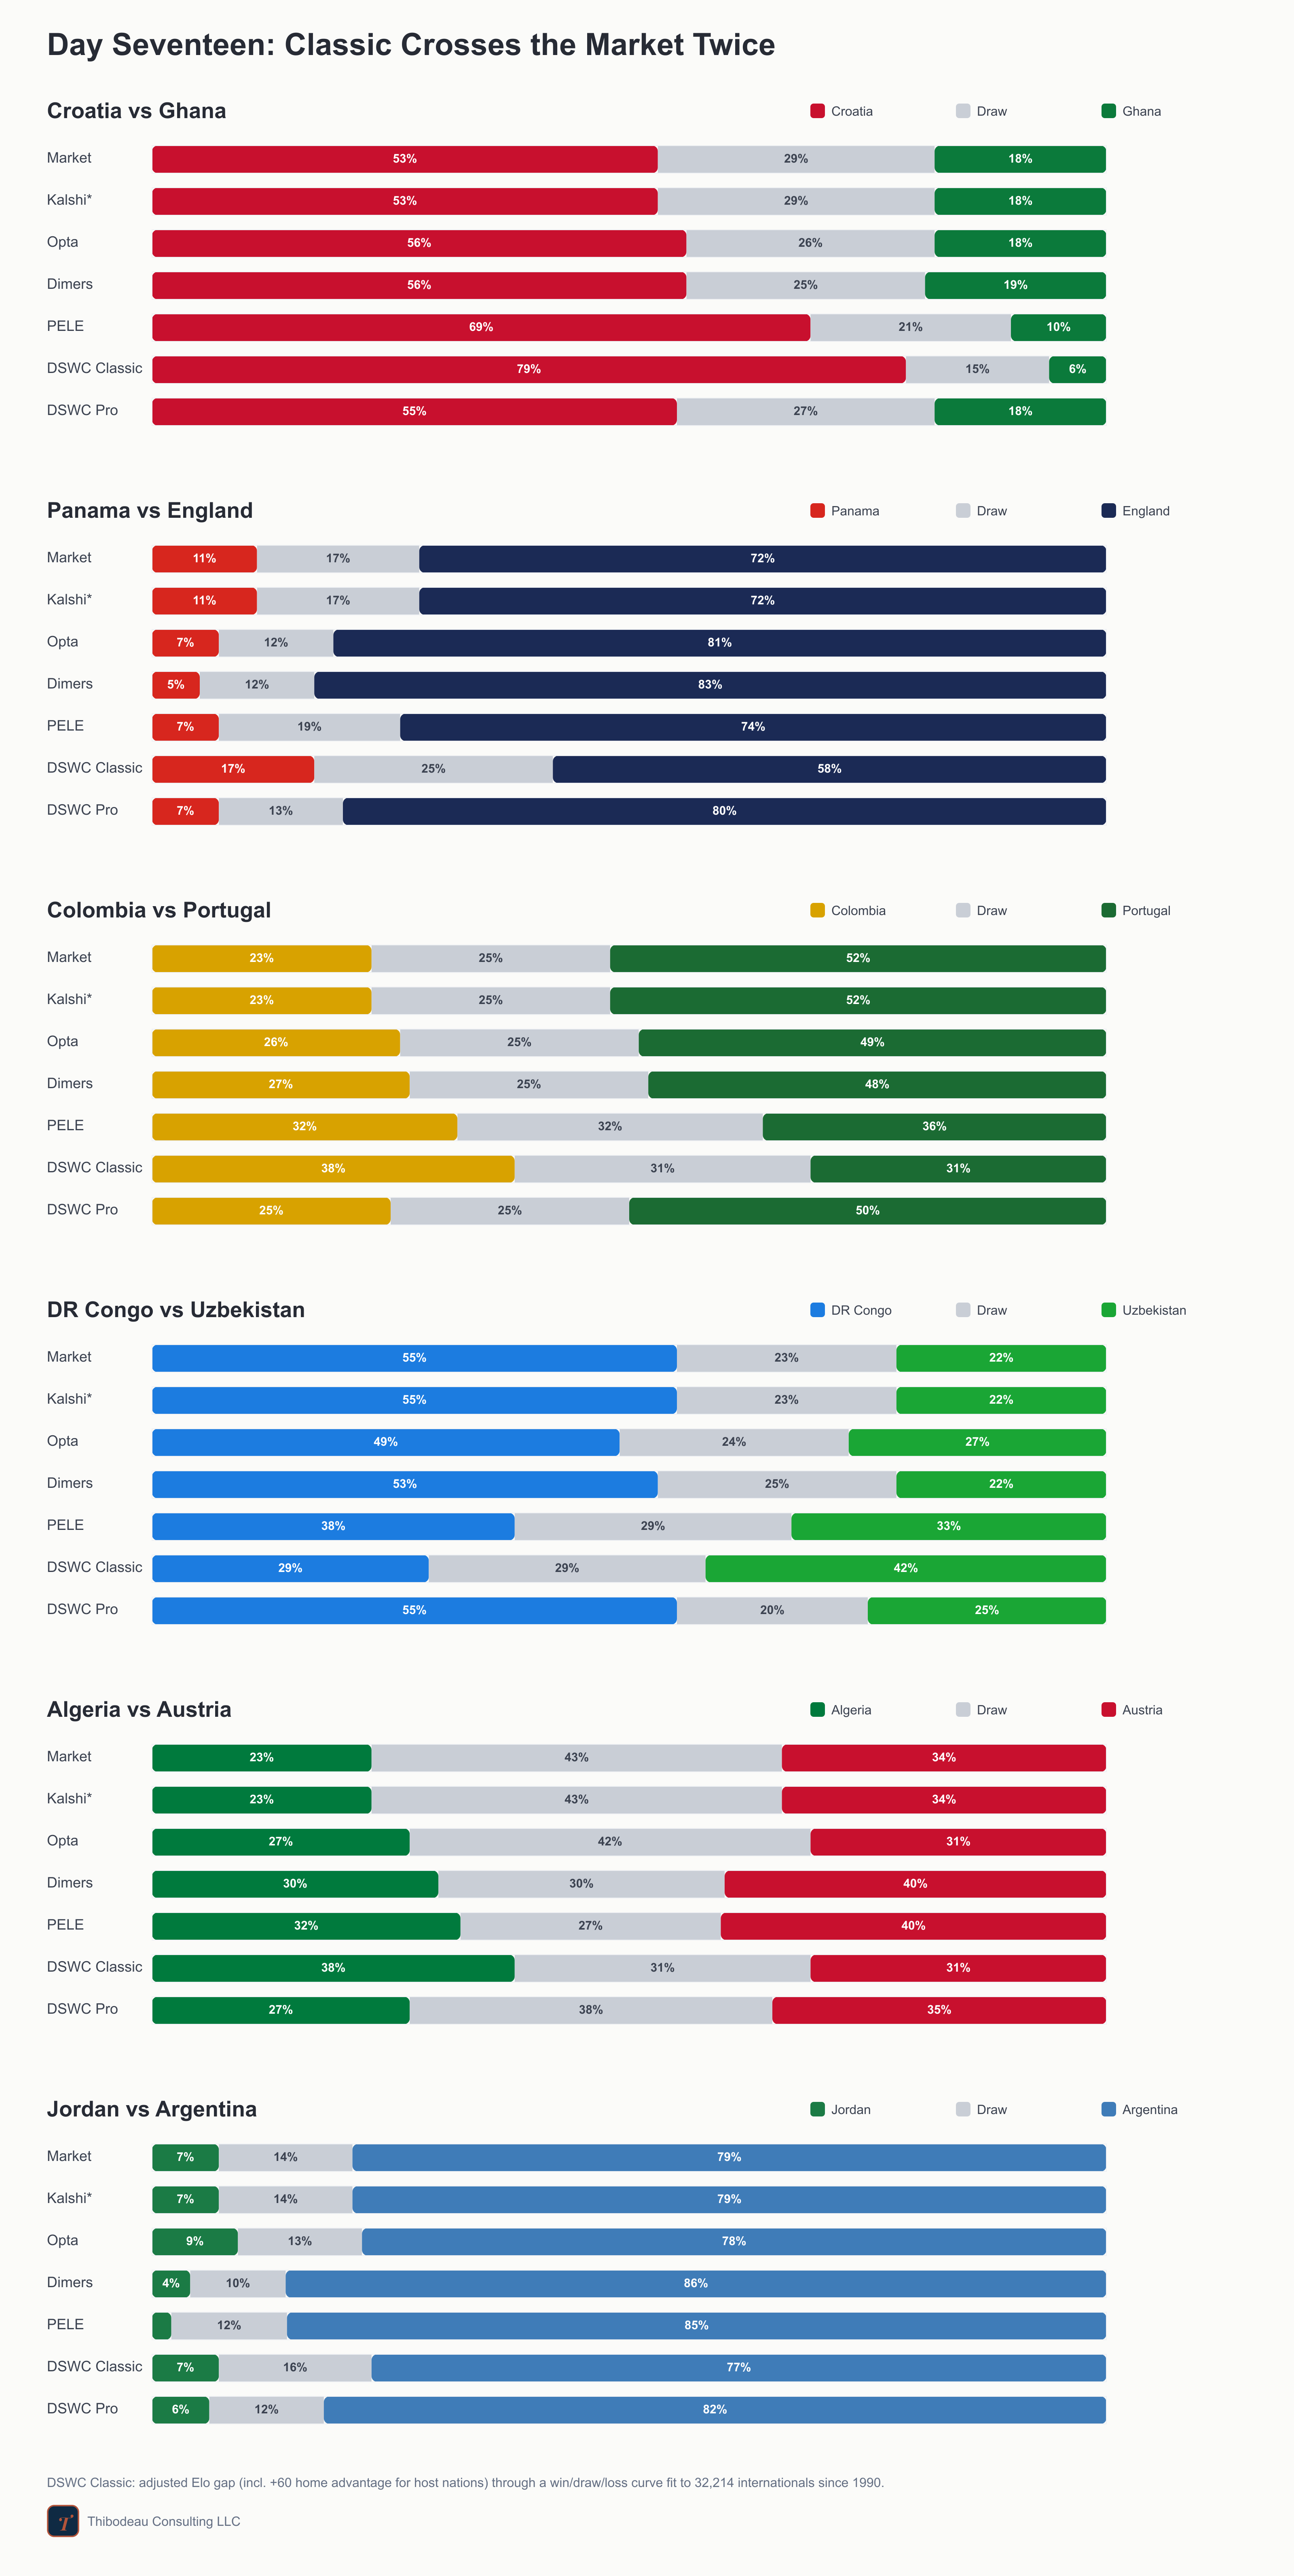
The final group-stage card is mostly consensus, with two places where Classic crosses the market. England and Argentina are heavy favorites in the games with the least table drama. The meaningful disagreement starts in Group K. The market makes DR Congo a clear favorite over Uzbekistan, 55 percent to 22,. Classic flips it, putting Uzbekistan at 42 percent and DR Congo at 29.
Classic also crosses the market in Algeria-Austria. The market makes the draw the most likely result and Austria the likelier winner, but Classic has Algeria as the top outcome at 38 percent. That one matters because the winner takes second behind Argentina, while the loser probably spends the night in the third-place pile.