
Can We Trust Recent Form?
A World Cup team’s last few matches feel like evidence. But are they reliable, valid, or just noise?

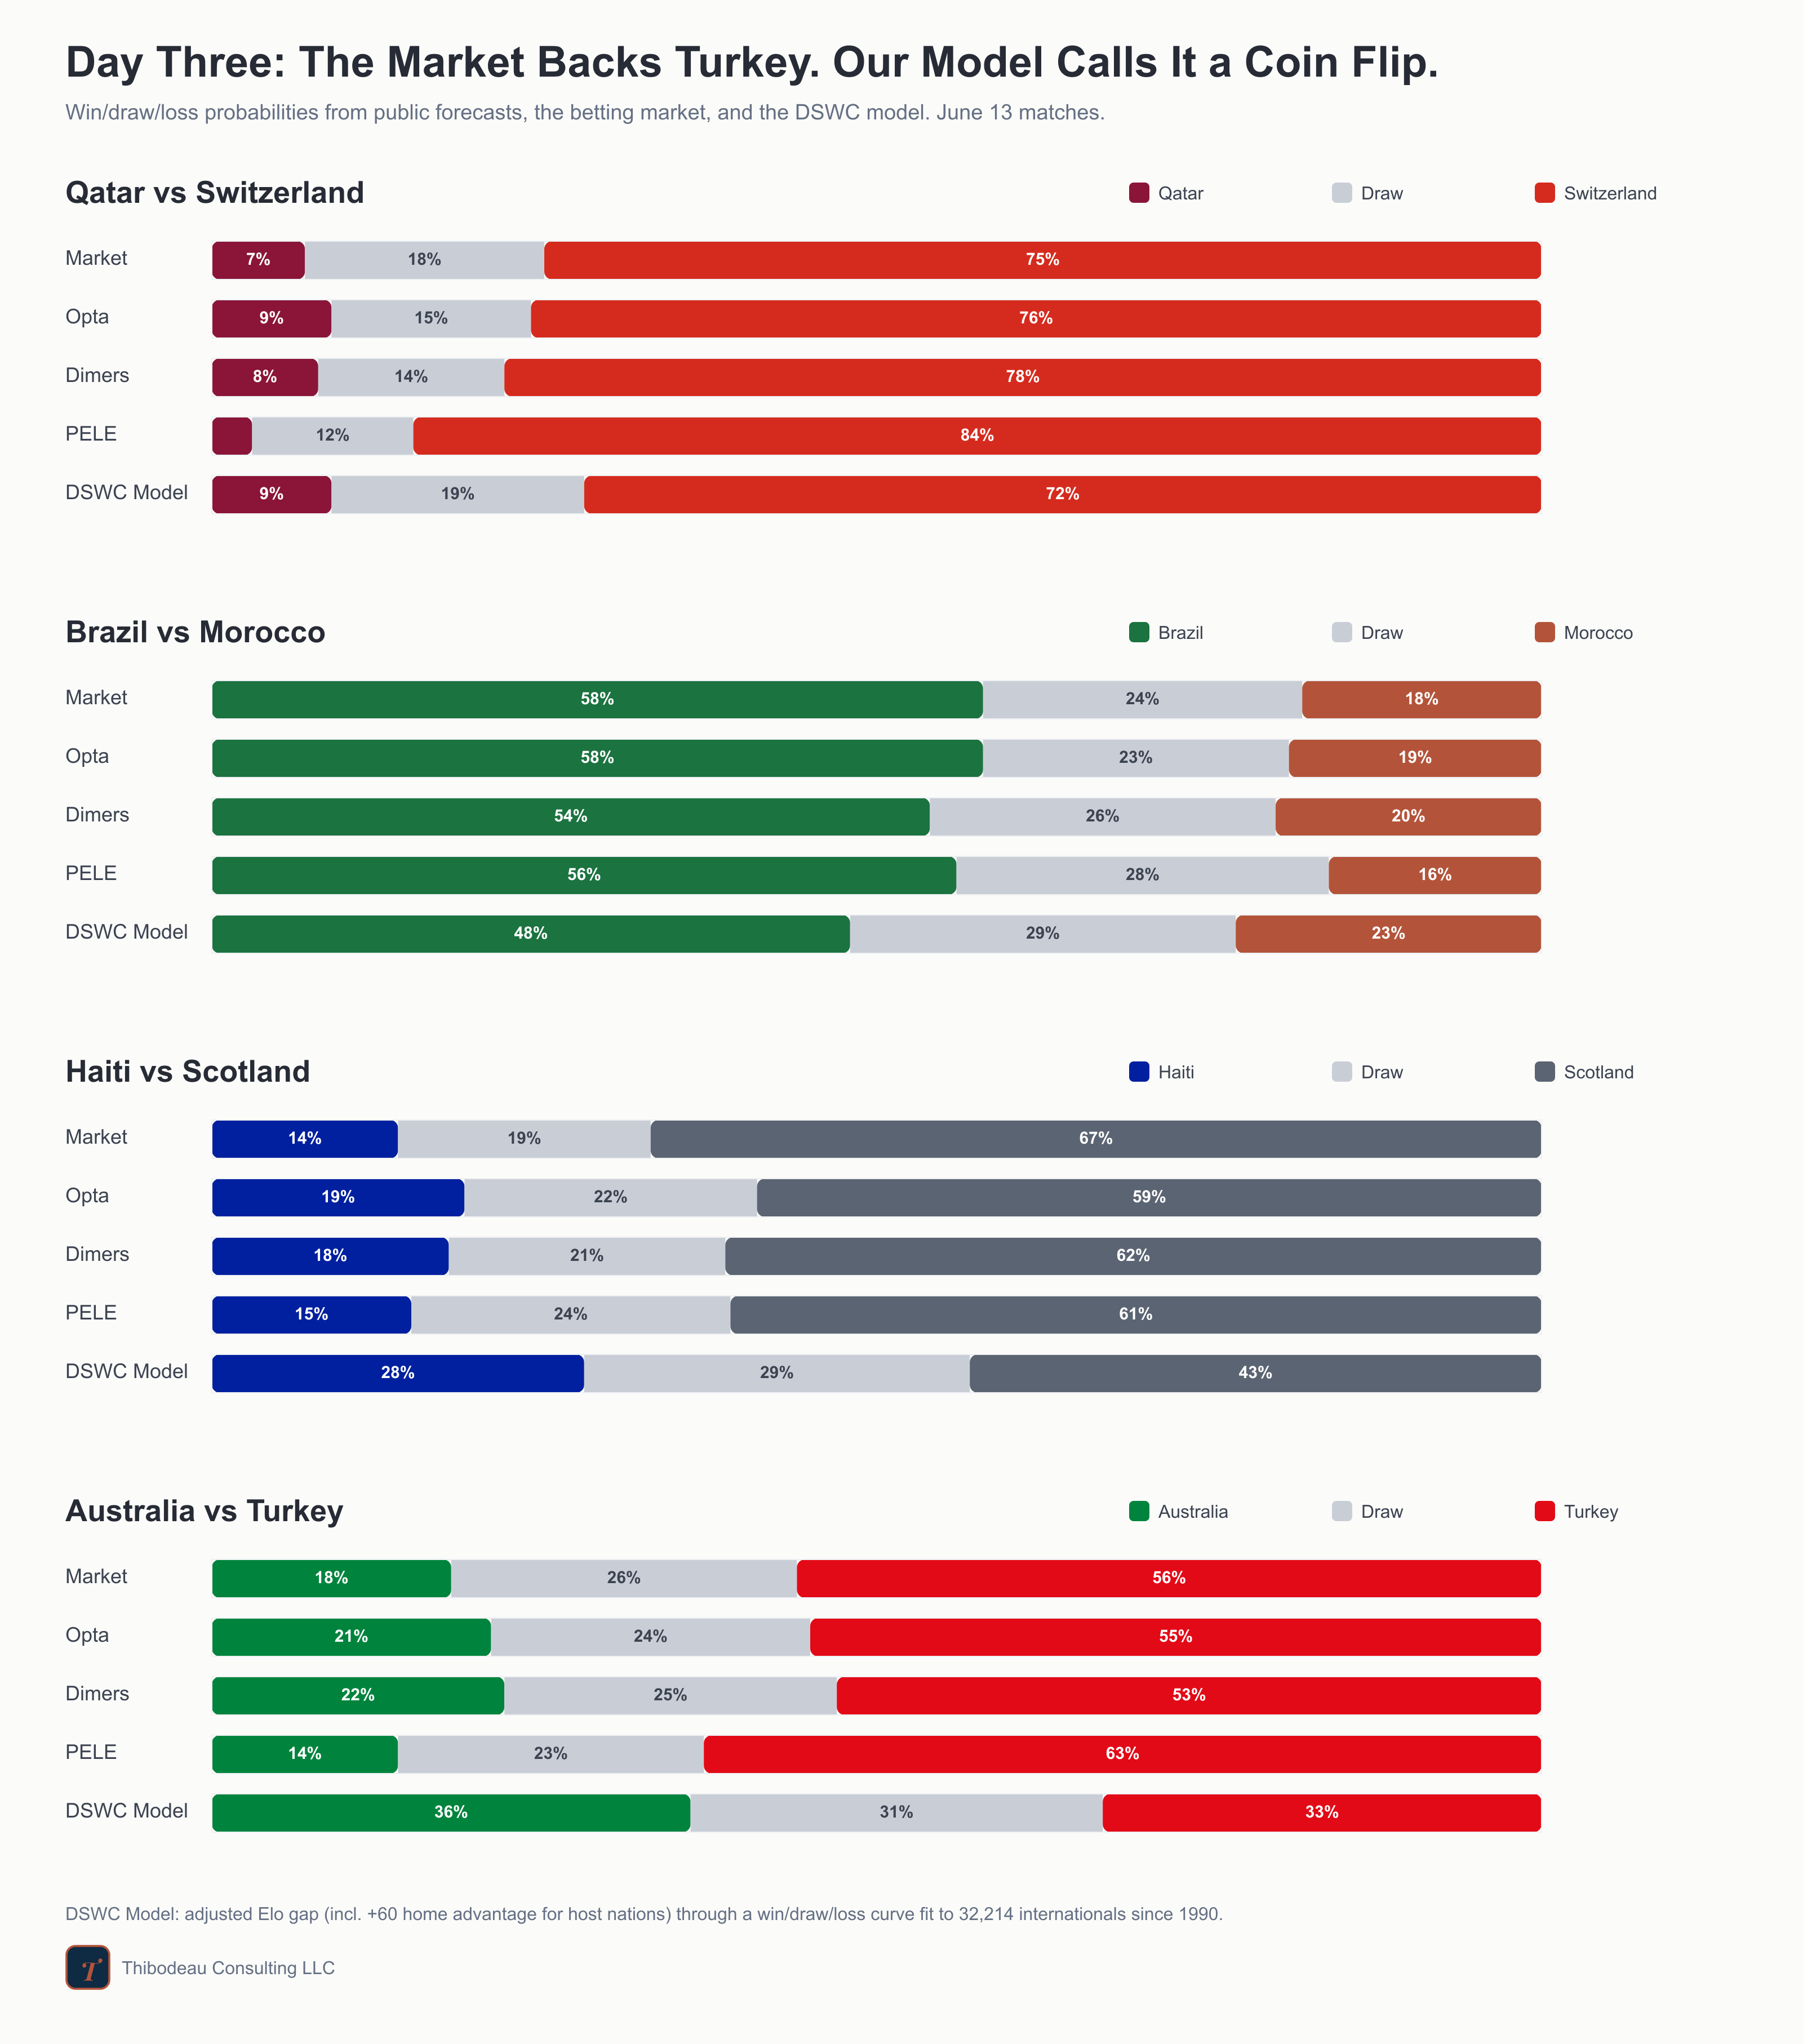
Day three, and the tournament starts to sprawl. Four matches, four cities, and our first real taste of the 48-team World Cup rhythm: Qatar-Switzerland in the Bay Area, Brazil-Morocco in New Jersey, Haiti-Scotland in Boston, and Australia-Türkiye in Vancouver. Before we get there, a quick recap.
Previously, at the World Cup
Now the tournament has a personality. Yesterday gave us one tidy host-country story and one messy model story. Canada finally put a point on the board, drawing Bosnia and Herzegovina 1-1 in Toronto for the first positive result in its men’s World Cup history. Then the United States turned SoFi into a launch party, beating Paraguay 4-1. The forecasts had a less comfortable day. Our model loved Canada too much, and the US not enough. More on that at the bottom.
Today, at the World Cup

Question 3: When a team is “in form,” what do we actually know?
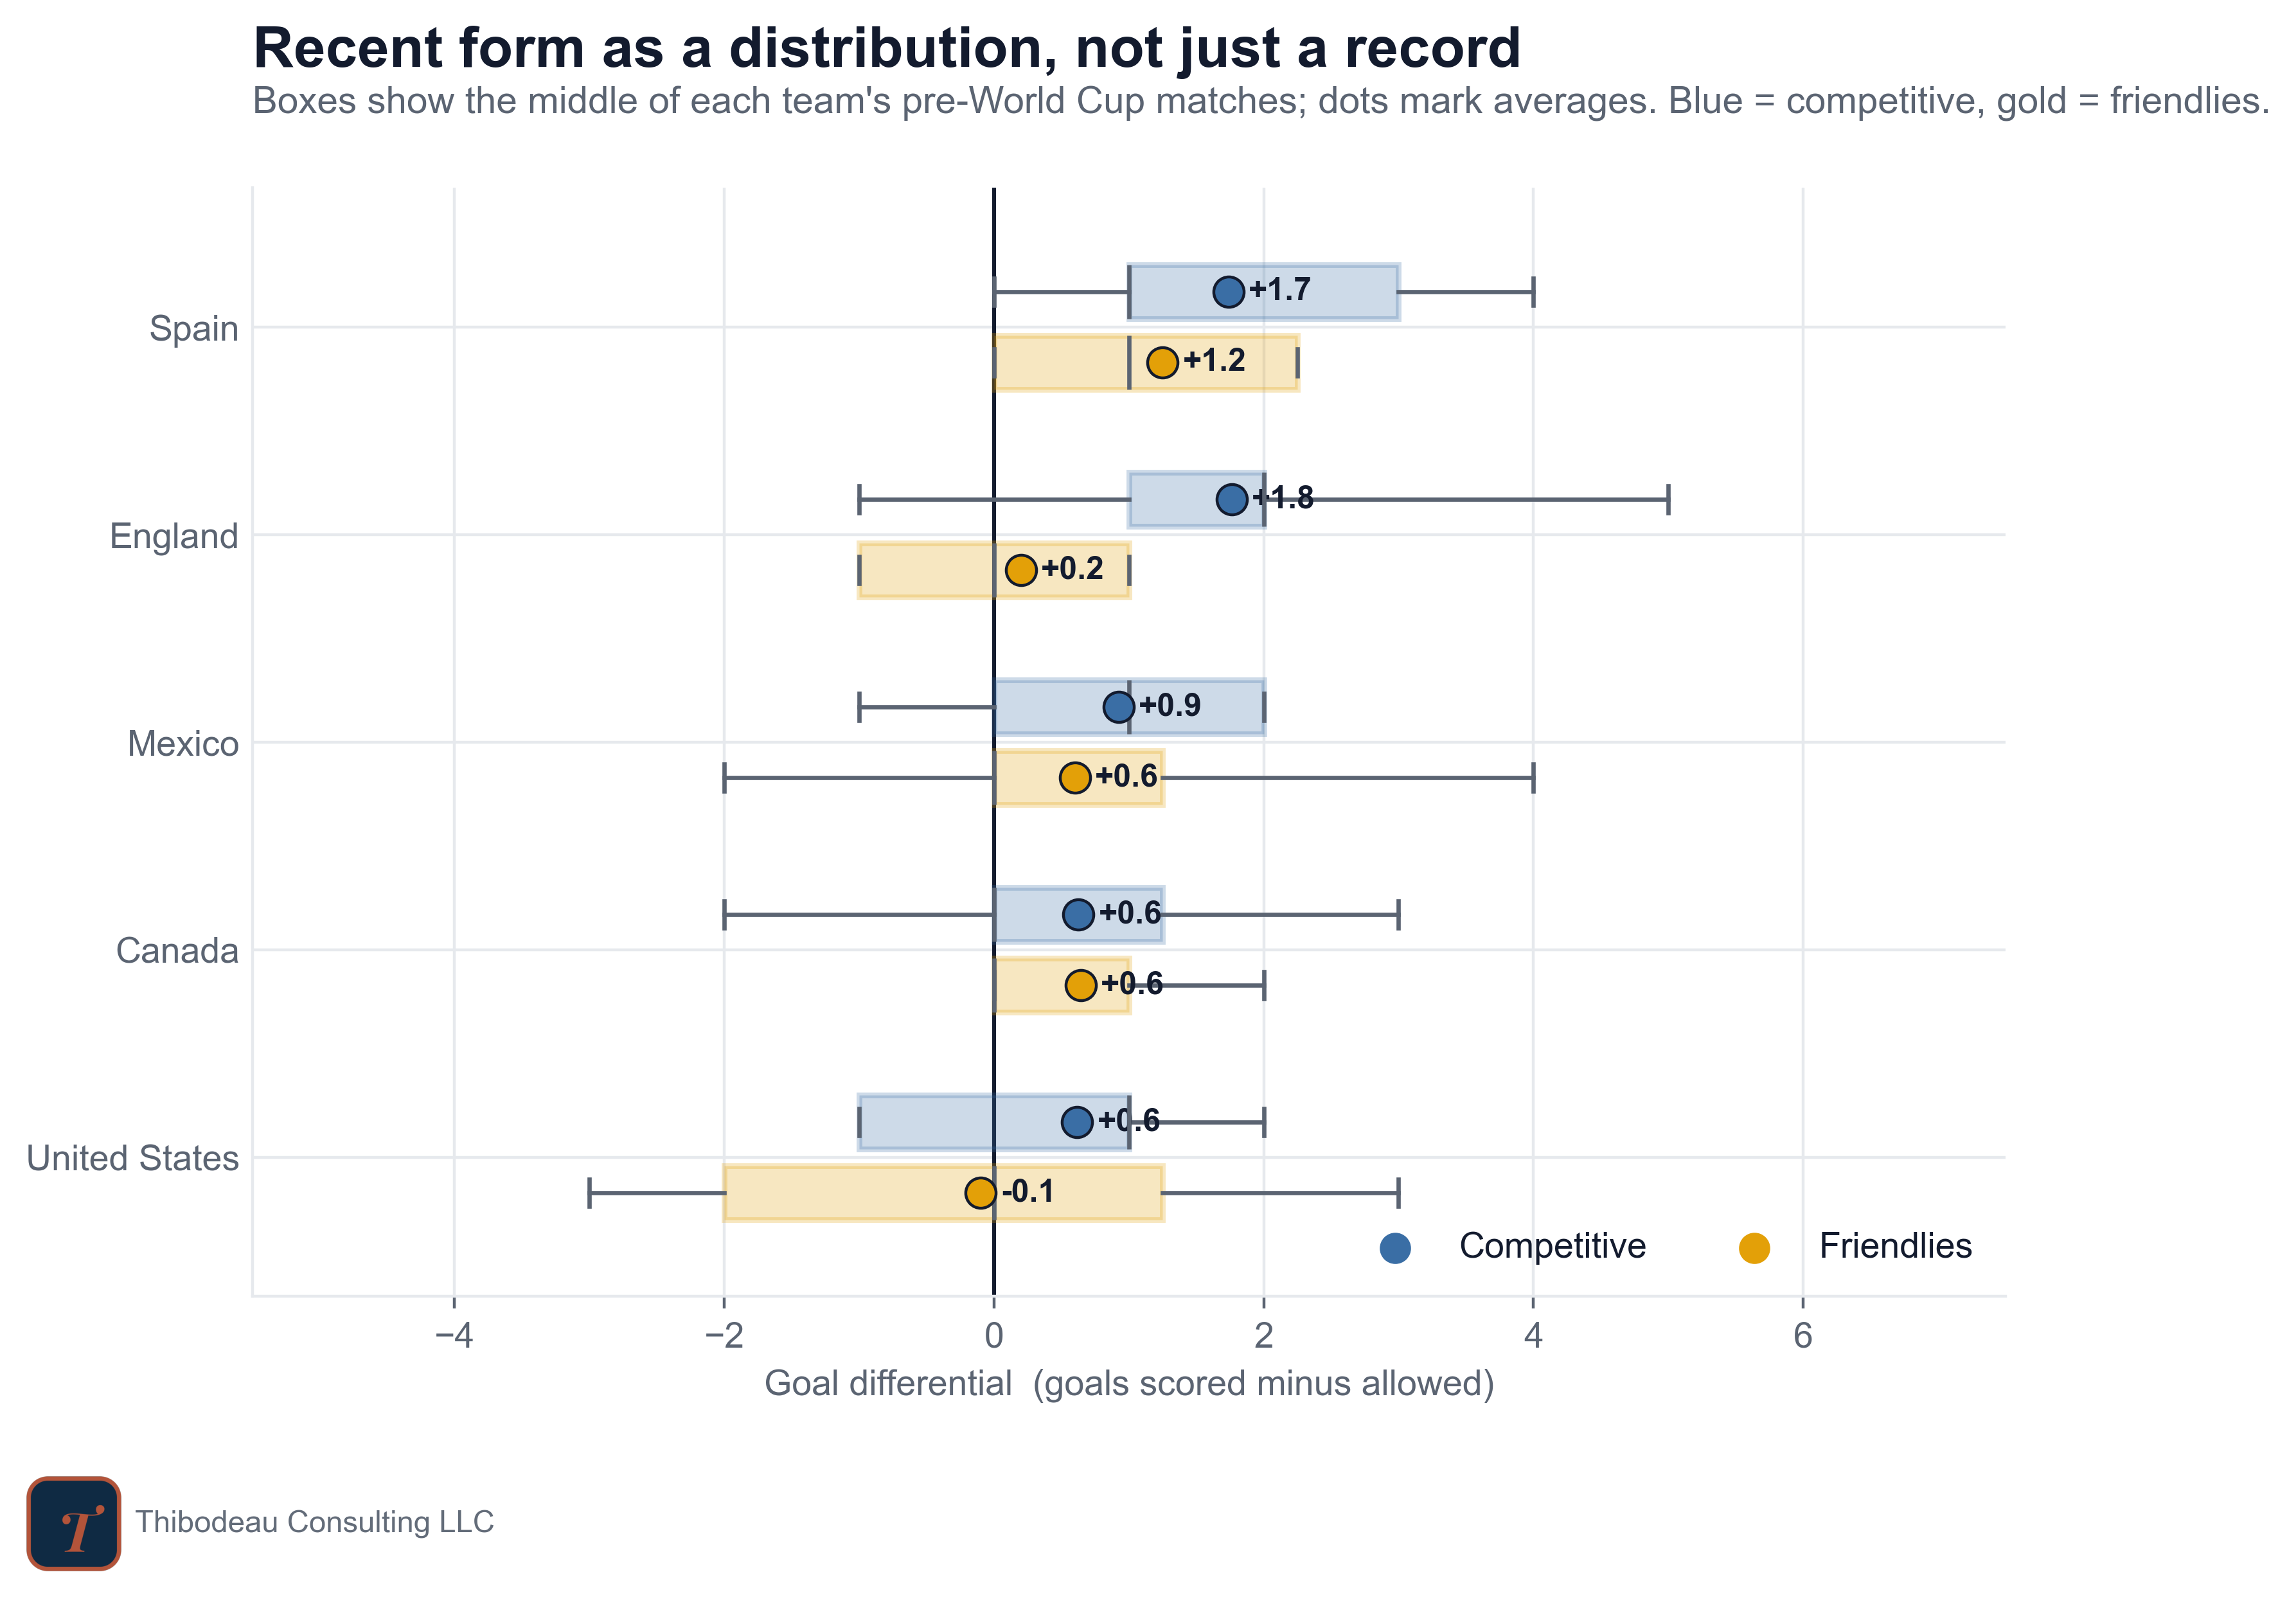
Soccer fans love to talk about recent form. Usually they mean results from the matches that count: qualifiers, continental tournaments, and other competitive games where there are stakes. We’ve called that recent competitive form, and separated it from recent friendly form, the exhibition matches that supposedly do not count. For both, I’m using the same simple measure: goal differential, or goals scored minus goals allowed.
Let’s look at the United States. In its final five pre-World Cup matches, the raw goal-difference by game was all over the place: a 1-2 loss to Germany (-1), a 3-2 win over Senegal (+1), back-to-back 0-2 losses to Portugal (-2, -2), and a 2-5 loss to Belgium (-3). Add those up and the U.S. looks cold: five matches, four losses, and a combined goal difference of -7 (average GD = -1.7). But that summary also hides the point of the whole section. Those were all friendlies, and the opponents were Germany, Senegal, Portugal, Portugal again, and Belgium. Recent form is not just “how did you do?” It is also “who did you do it against?”
The last five competitive matches for the US look much better: Mexico -1, Guatemala +1, Costa Rica 0, Haiti +1, Saudi Arabia +1. That is a 3-1-1 record with a combined goal difference of +2, but against weaker opponents. So depending on which “recent form” you mean, the U.S. either looks like a team getting beaten up by elite opponents or a team mostly taking care of business against a softer competitive schedule. That is why recent form needs more care than the phrase suggests.
Here’s what those two numbers look like for the teams we’re following. The bars and whiskers show the distribution of each team’s game results, in terms of goal differential. The US, for example, has won a recent friendly by 3 goals and lost a recent friendly by 3 goals, averaging a -0.1 goal differential in our window.
On our day-one board, recent competitive form was the weakest signal we measured. Team quality, yesterday’s star, correlated +.38 with advancing from the group. Meanwhile, goal differential in competitive matches over the pre-World Cup year correlated only +.14, the lowest of the main features we tried. The same statistic from friendlies hit +.41.
Today is about why. The answer comes in two main parts, and they map onto two of the most useful ideas in measurement: reliability and validity.
Problem one: not enough games
Reliability asks whether a measure agrees with itself. Weigh yourself twice in quick succession and the scale should give roughly the same answer. If it doesn’t, you may be standing on a random number generator instead of a scale.
So let’s weigh recent form twice. For every World Cup team since 1998, I split the year before the tournament in half and computed goal difference per game in each half. Same team, same season, same measure, two readings. If recent form captures something stable, the two halves should roughly agree.
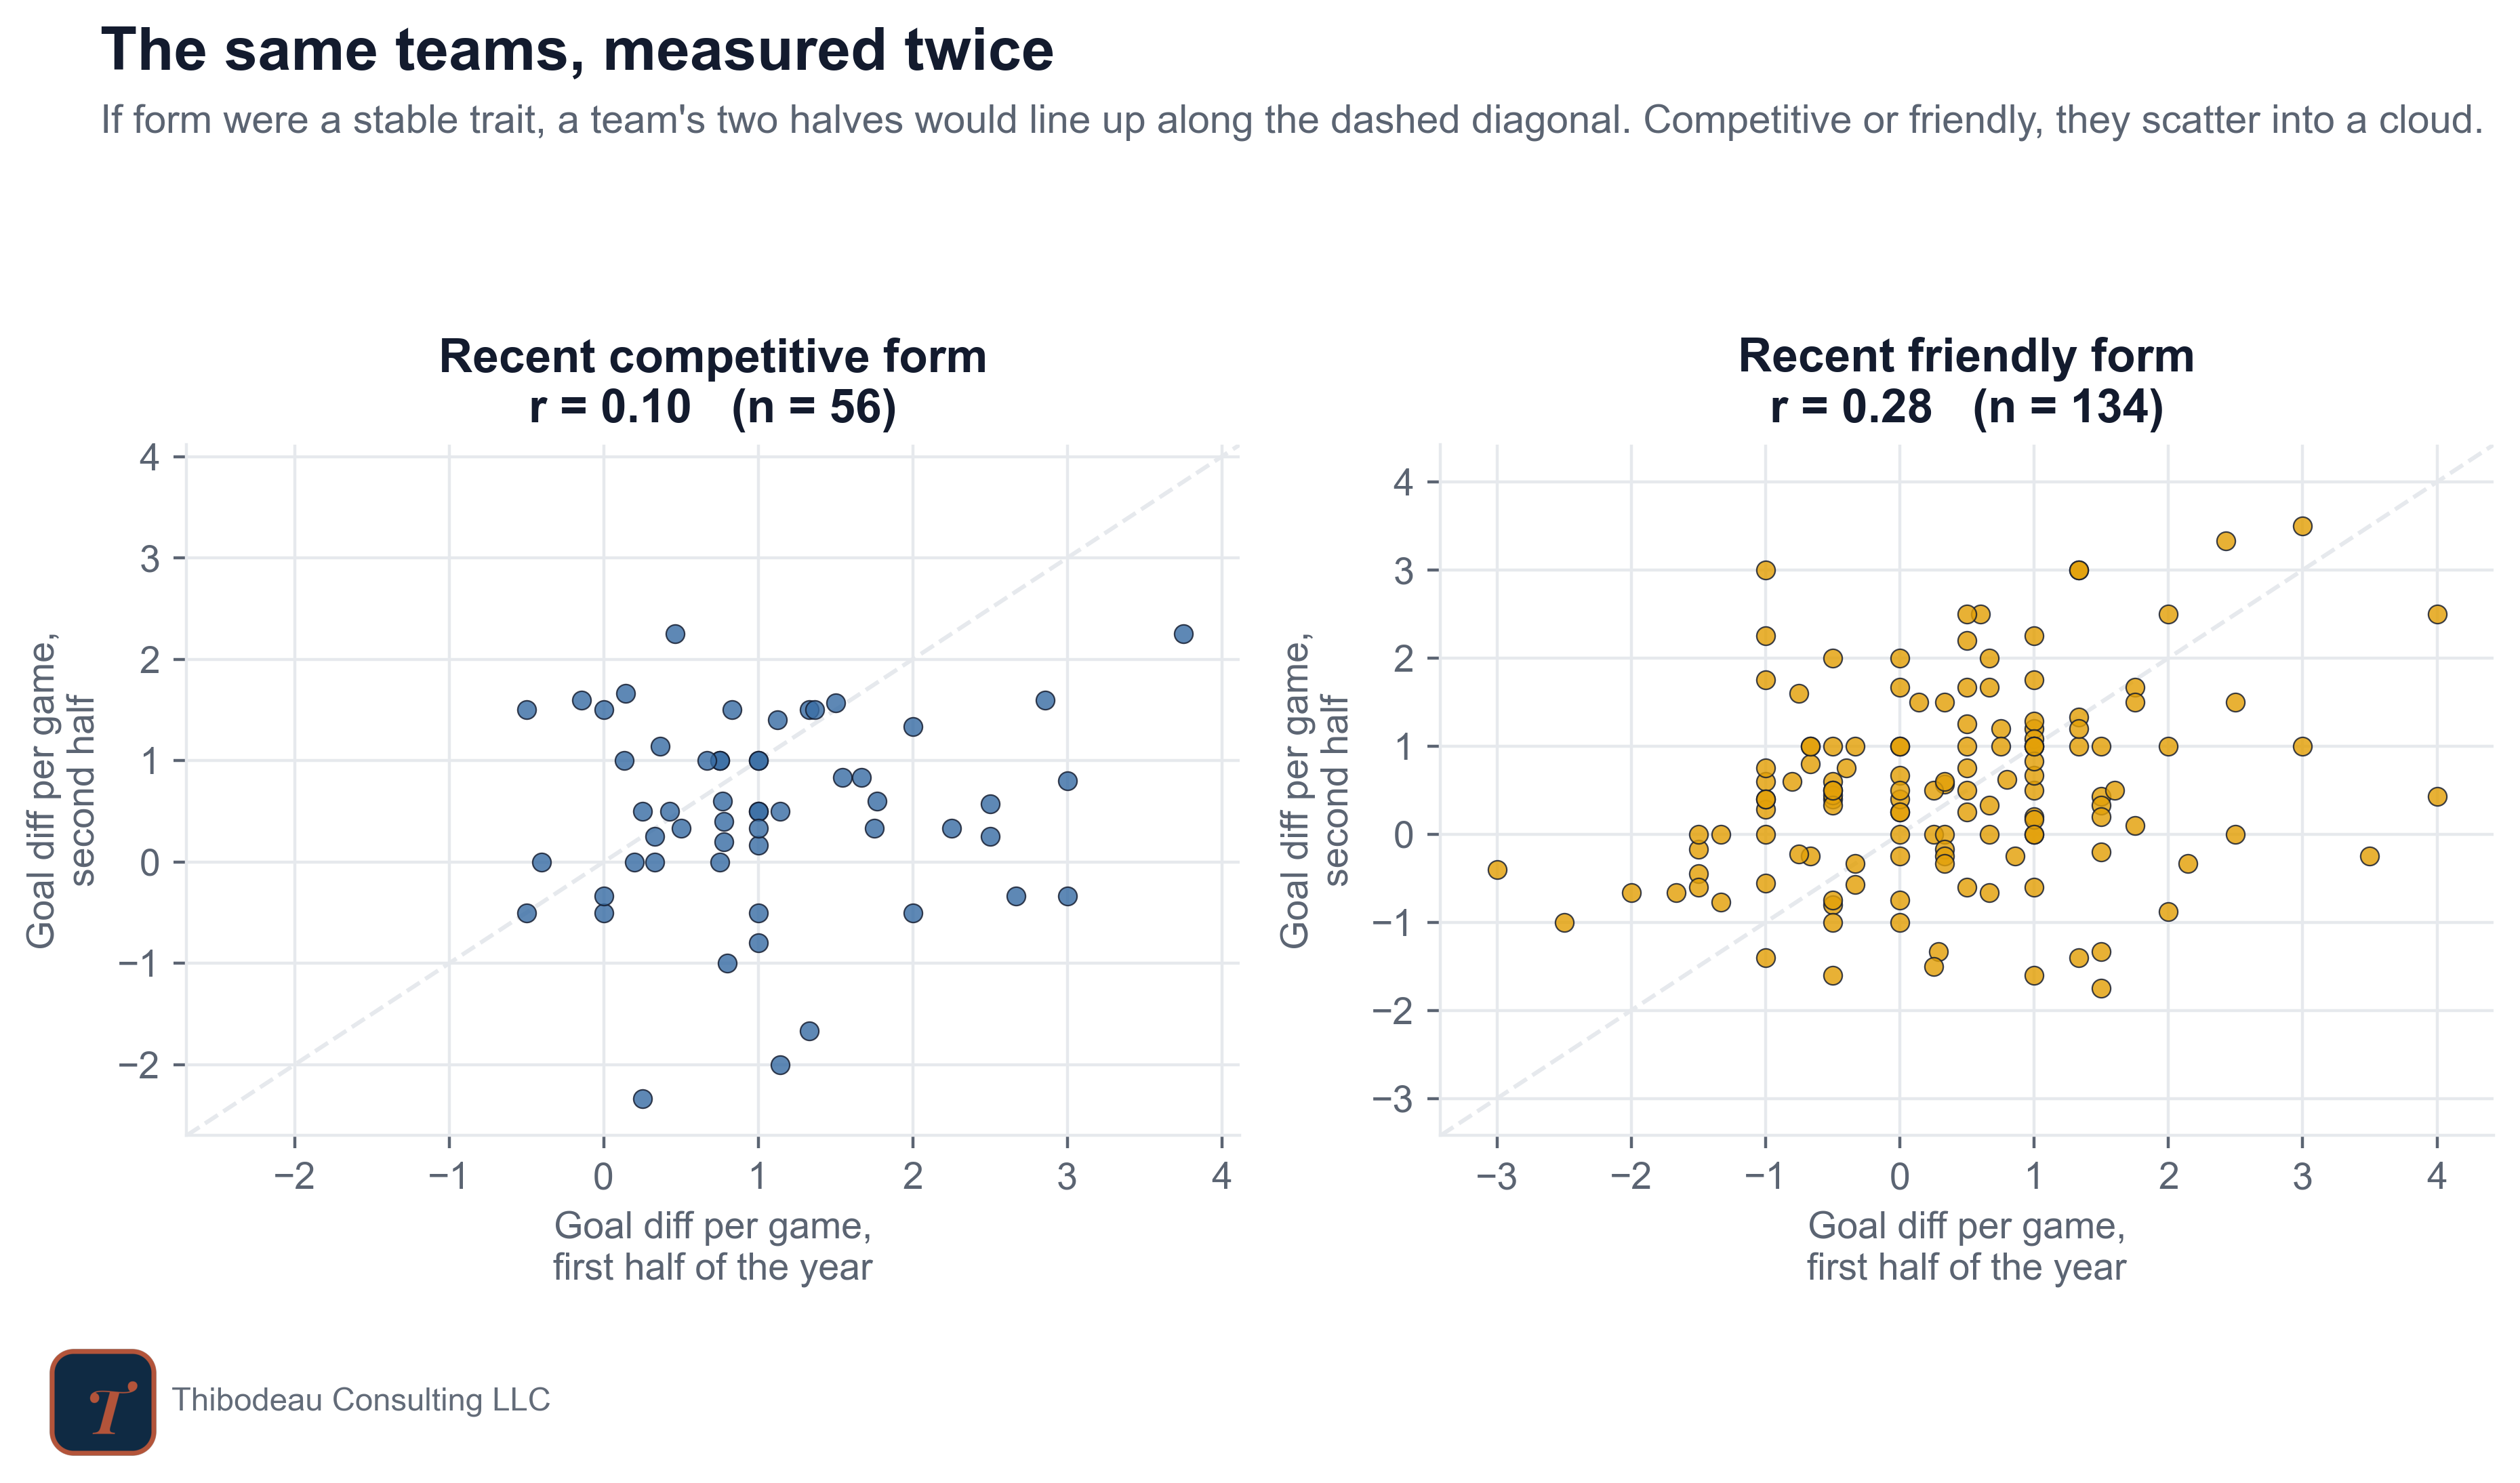
They do a little, but not enough to make them reliable. Each dot is one World Cup team since 1998. The x-axis is goal difference per game in the first half of the pre-tournament year; the y-axis is the same statistic in the second half. If form were stable, the dots would cluster along the dashed diagonal. Instead, they scatter. Competitive form is mostly noise: r = 0.10, meaning the first half of the year tells us almost nothing about the second. Friendly form does a little better at r = 0.28, but that is still weak. The takeaway is not that form is meaningless. It is that form, measured over a short international window, is a jumpy instrument; it’s just not that reliable.
The plot highlights a second challenge with using recent competitive form as an indicator of team quality: there often just aren’t enough games. Qualifying is mostly finished by the time the World Cup approaches, so the final months are dominated by friendlies. In the last half-year before kickoff, 63% of World Cup teams play no competitive match at all, compared with just 2% that play no friendly.
And even when there are games, they are not always measuring the same team. International lineups change constantly: stars are rested, injured players miss windows, managers experiment, club teams limit availability, and warm-up matches often become auditions for the last few roster spots. That adds another layer of noise. Recent form is not only a short test; sometimes it is a short test taken by a slightly different group of players.
Problem two: it measures the schedule, not just the team
Validity asks whether a metric actually reflects what it claims to measure.
Competitive form sounds like the gold standard metric of team quality because those games have stakes. But a contender’s competitive schedule in the year before a World Cup is often mostly mismatched qualifiers.
Friendlies work differently. They are scheduled, and strong teams often use them to test themselves against other strong teams. Among the 208 World Cup teams since 1998 with enough matches of each kind, the average friendly opponent was rated 63 Elo points stronger than the average competitive opponent. And 72% of teams faced tougher opposition in friendlies than in competitive matches. The games that “don’t count” were often the better test.
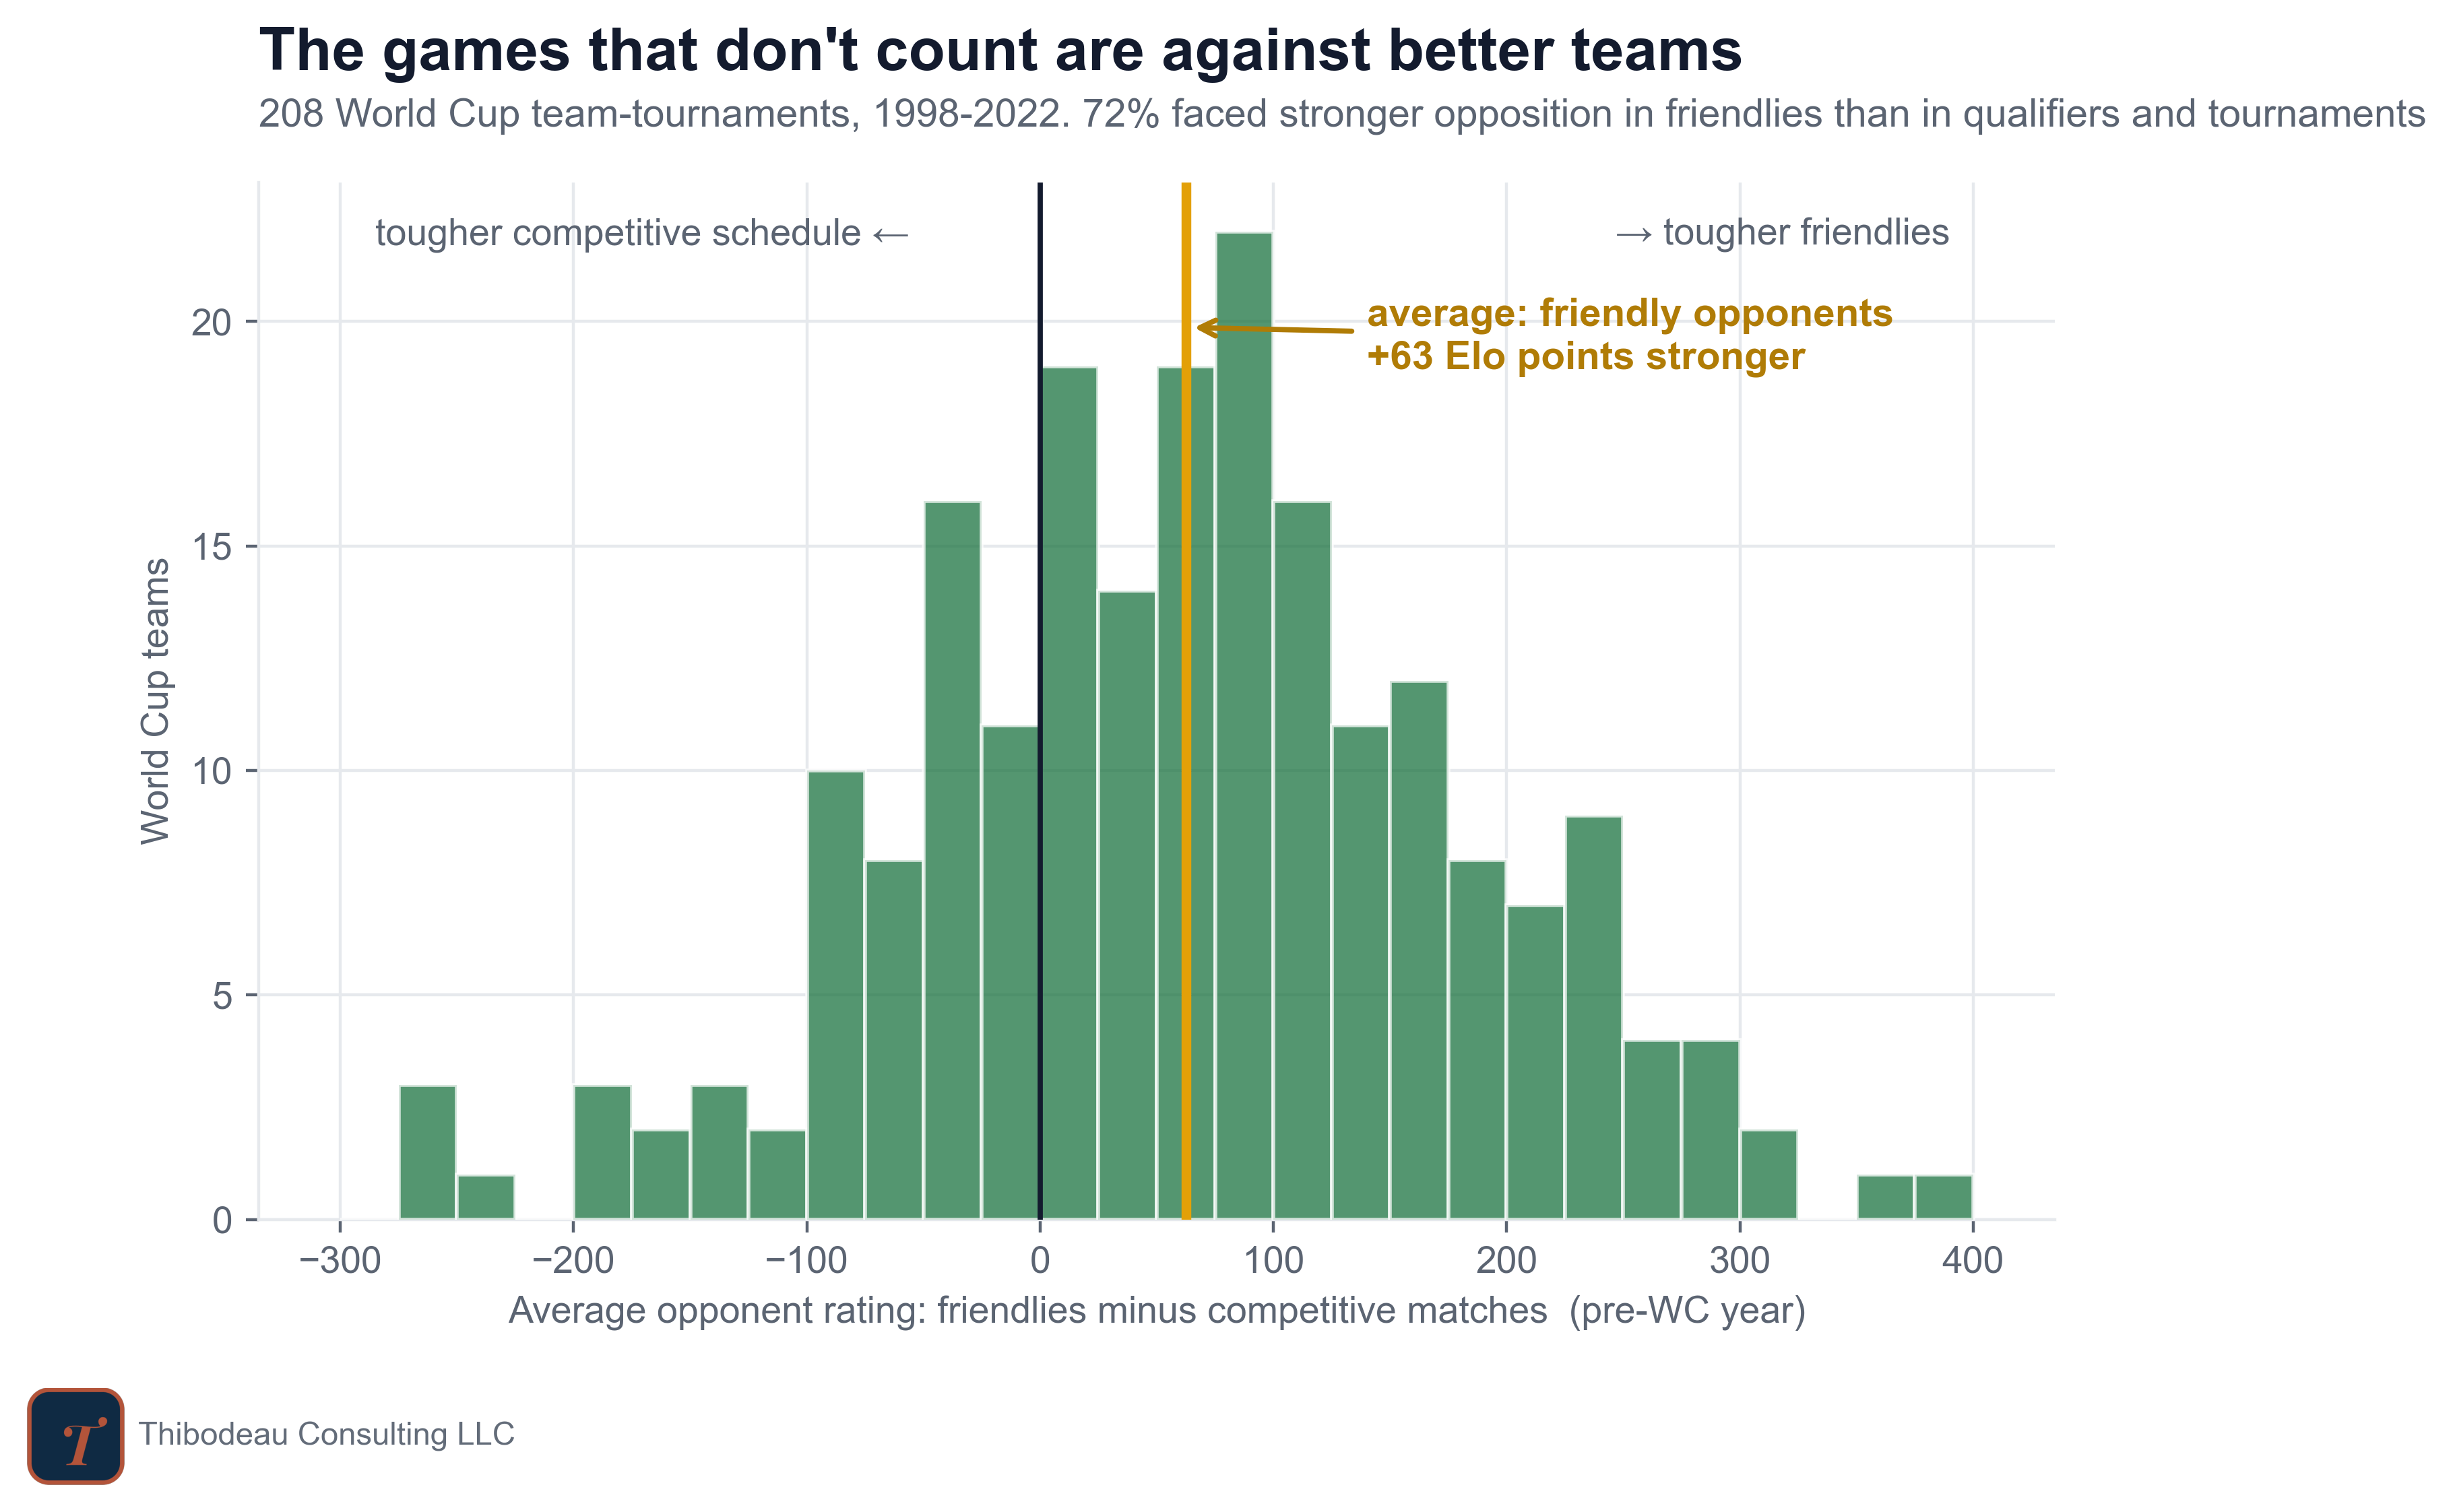
That helps explain the day-one puzzle. Recent form in friendlies was more predictive partly because friendlies were against better teams. Competitive form was tangled up with schedule softness.
Other Problems
There are other problems with this measure, too. Goal difference is blunt. It treats a 1-0 win built on ten good chances the same as a 1-0 win built on one deflection and a goalkeeper miracle. It ignores shots, shots on target, expected goals, lineup strength, red cards, game state, travel, and whether the match looked repeatable or lucky.
It also throws away useful information inside the variance. A volatile team is not the same as a bad team. Some teams produce wild, high-event games; others grind everything toward 1-0. Two teams can have the same average goal difference and very different risk profiles. That may matter in a World Cup, where surviving the group and winning knockouts are not quite the same problem.
We’ll come back to this in a future article by testing whether we can develop better versions of recent form: opponent-adjusted results, surprise scores against the rating curve, shot-based measures, expected goals if we can get enough of it, and measures of consistency versus volatility.
Where this goes next
Tomorrow, we’ll start looking at some of the strangest features on the board: the ones that say almost nothing about how good a team is at soccer and still predict anyway. Hosting. Defending the title. World Cup experience. We’ll go hunting for the mechanism behind each one.
Daily Delivery
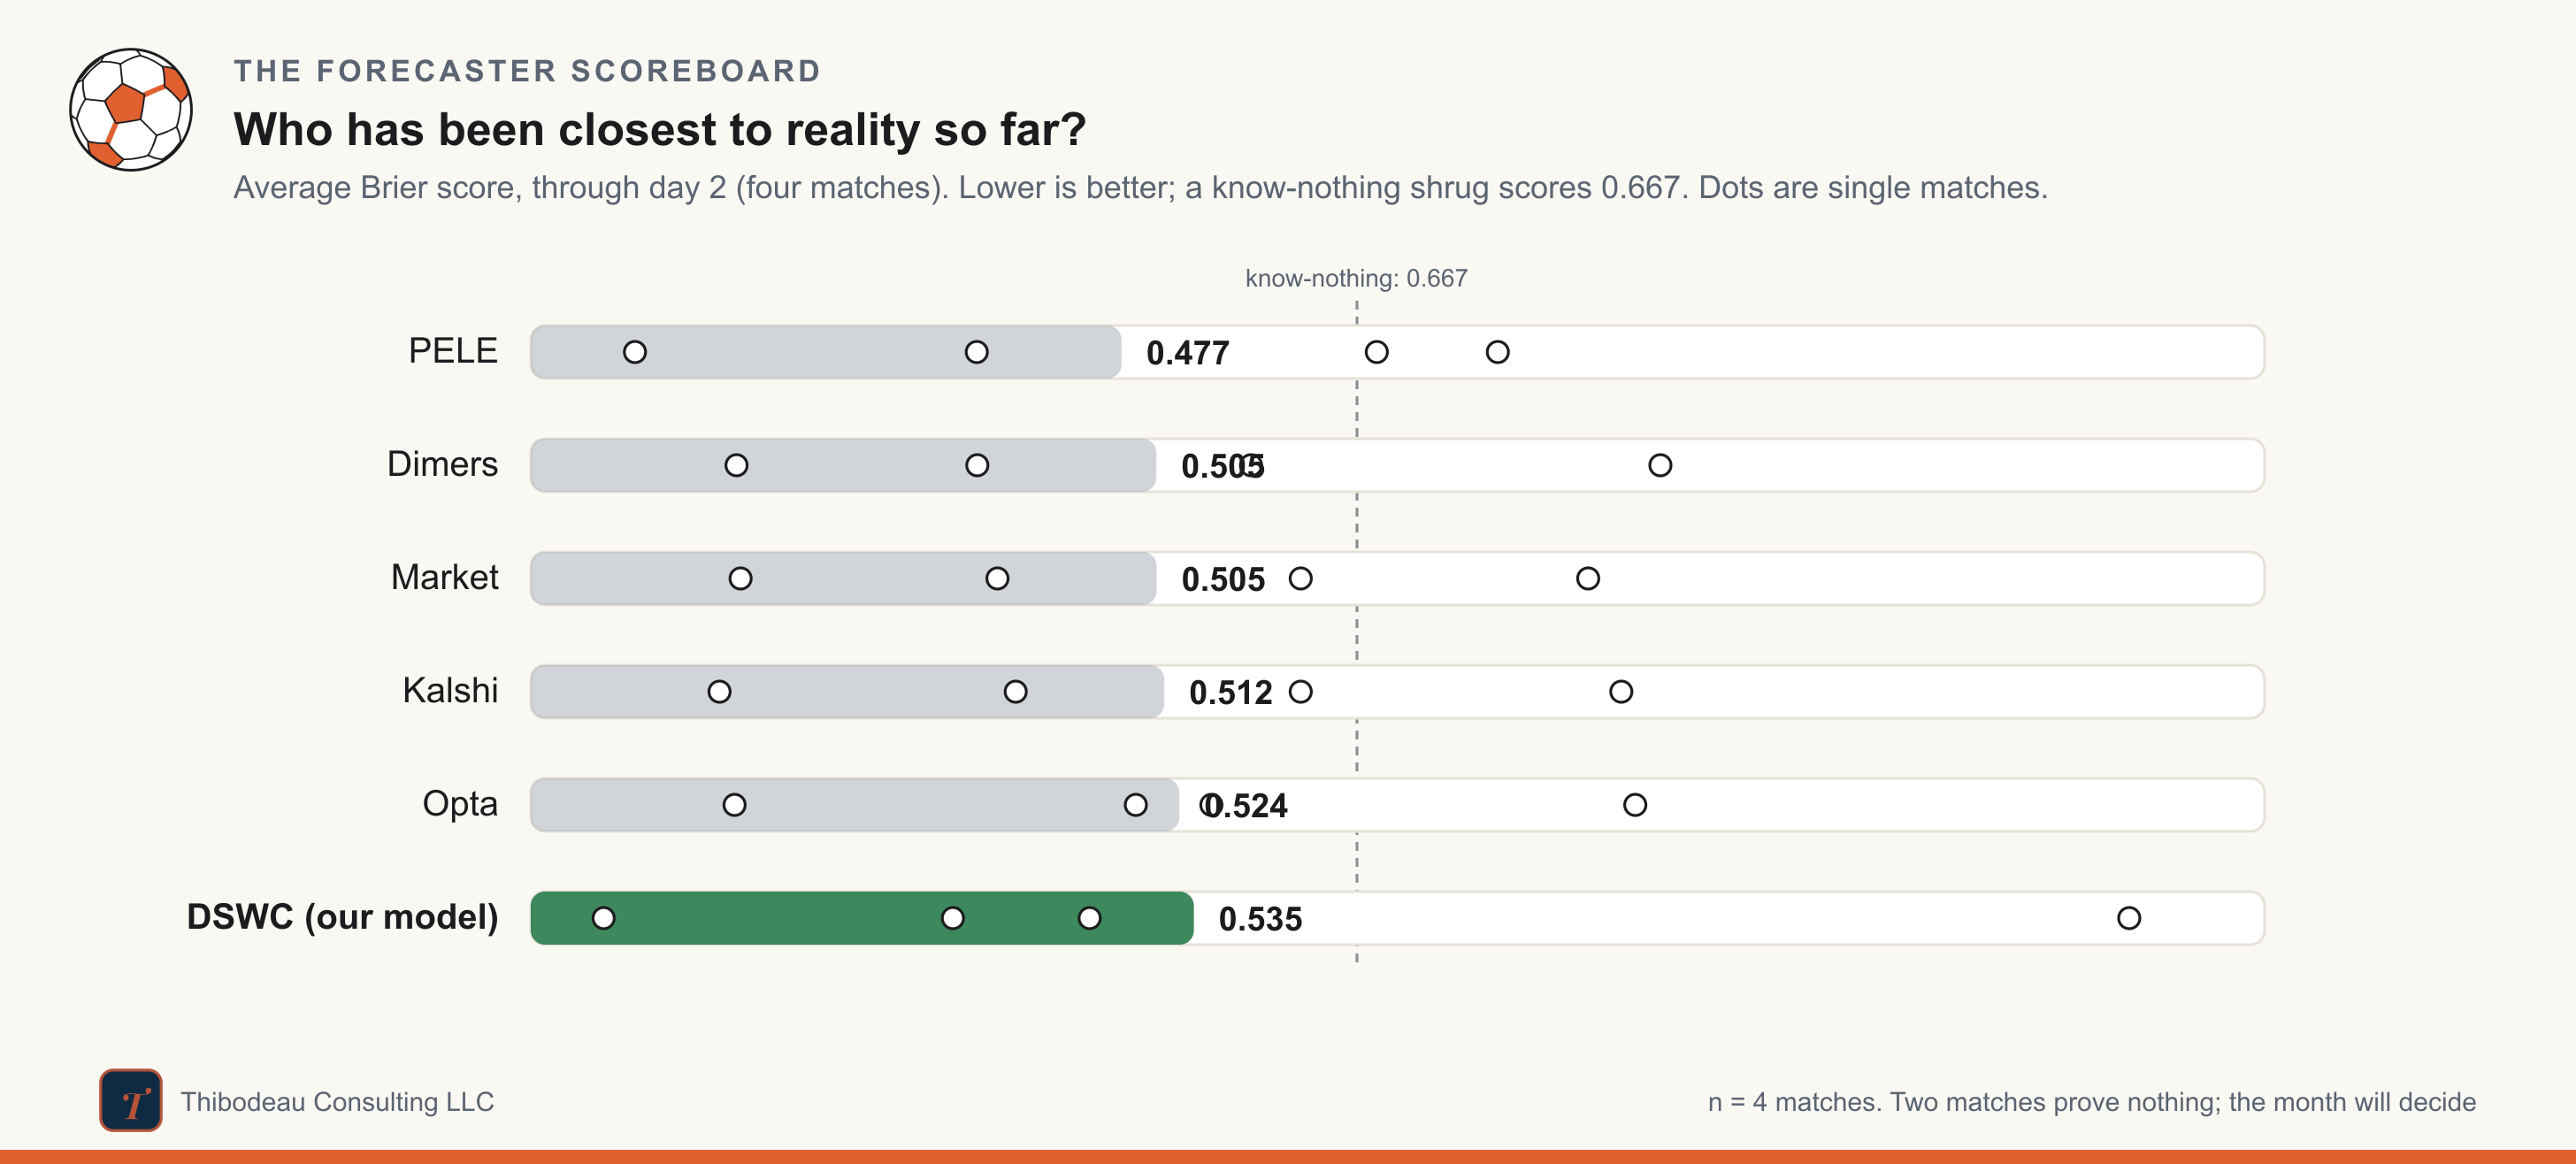
Yesterday, graded. Both day-two matches punished our model, in opposite directions. Canada drew when we had them at 77 percent to win. Then the United States won 4-1 after we gave them only a 45 percent chance.
Add yesterday to the opener and four matches leave the scoreboard like this: Nate Silver’s PELE leads at 0.477, with the market, Dimers, and Kalshi bunched just behind around 0.505, and DSWC last at 0.535. That is the cost of conviction. A model that takes big positions can win big and lose big.
Today’s slate has four matches, with Brazil-Morocco as the headliner. The market makes Brazil a comfortable favorite at -160, roughly a 55 percent chance. Our model is cooler: Brazil 48%, draw 29%, Morocco 23%.
There is an even louder disagreement waiting in the nightcap. In Vancouver, the market makes Turkey a clear favorite over Australia, but our model calls it a coin flip: Australia 36%, draw 31%, Turkey 33%. It is the widest gap between us and the market on the slate, and it comes from the same instinct: rating over reputation. If you want to watch the model live or die on its convictions, that is the one.
Great work Paul, excited to see how your model does today! Do you have any individual player predictions? Balogun for golden boot confirmed?